
News Roundup: 50 bps Rate Cut, Have Emerging Markets Emerged – and Are Utility Stocks Cheap?
Fed Cuts by 50 bps – Market Unsure What to Do
Leading up to the Fed’s September 18th rate cut, the imputed market predictions swung from a 25 basis point cut and a 50. The Fed supersized it, and markets seemed… confused: They spiked up before deciding to end Wednesday down 0.3%, then changed their mind to rise on Thursday by nearly 2% as I type.
It’s true that historically, half-point hikes have preceded recessions (but so have some other things that haven’t led to a recession recently), and it’s true – in a sense – that whether the immediate cut is 25 or 50 basis points is long-term irrelevant if Fed Funds end up 100 bps lower by the end of January and the entire peak-to-trough rate cut cycle ends up shaving 250 basis points off the peak Fed Funds rate, which is a normal clip.
If that doesn’t matter, then why did the market drop after the more pro-market larger cut? Bigger cuts are supposed to be better for stocks, right?
Nobody knows.
It’s hard to say we’re not living in weird times.
The “inverted yield curve” recession indicator is broken. The Sahm Rule is also broken – even Claudia Sahm told me recently in our BBAE interview. The market’s response to a good-for-stocks move is to… drop?
We can, and usually do, look to history to guide us, but I’m not sure how well history can guide us right now.
What does the market do following rate cuts? Everyone has a slightly different opinion
My friend and former colleague Jim Royal wrote in Bankrate that rate cuts have been followed by 11% gains in the following year.
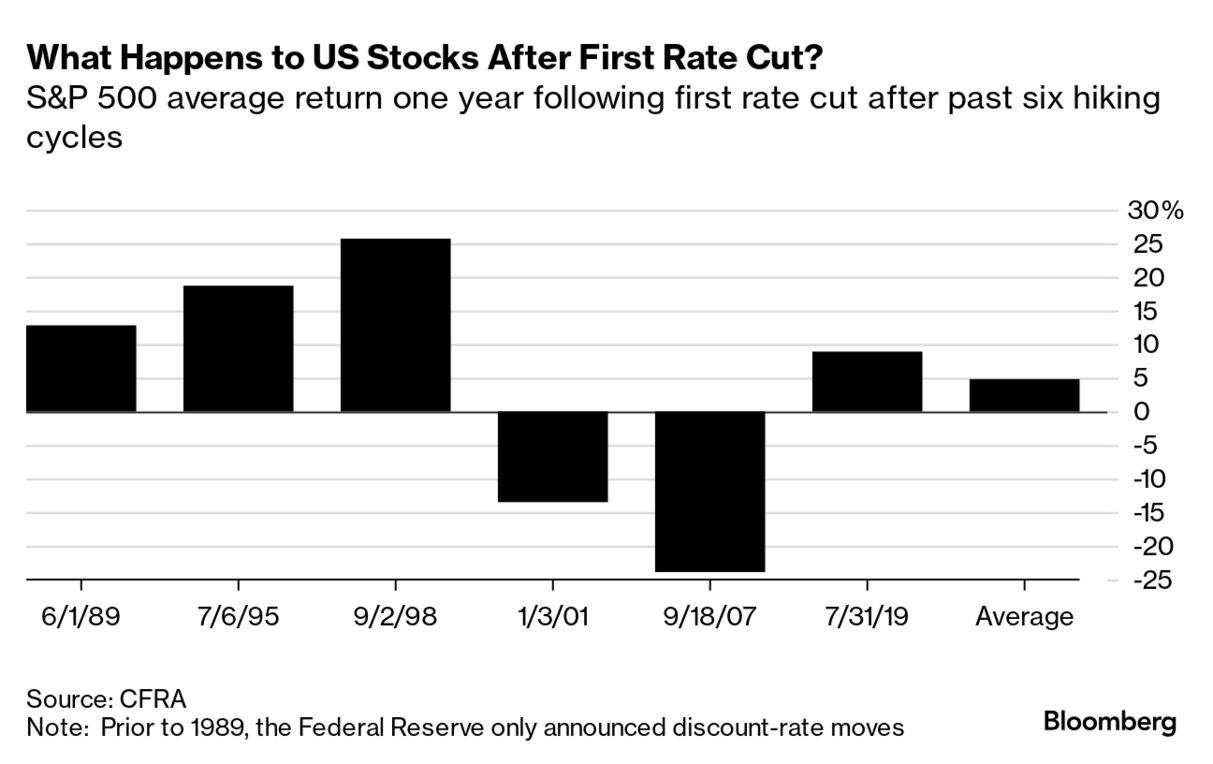
Less optimistic is Bloomberg’s data – if you yet know, it’s possible for semi-contrasting (or even contrasting) opinions to be “right” in economics if they’re citing different data – which seems to signal a 5% next-year again.
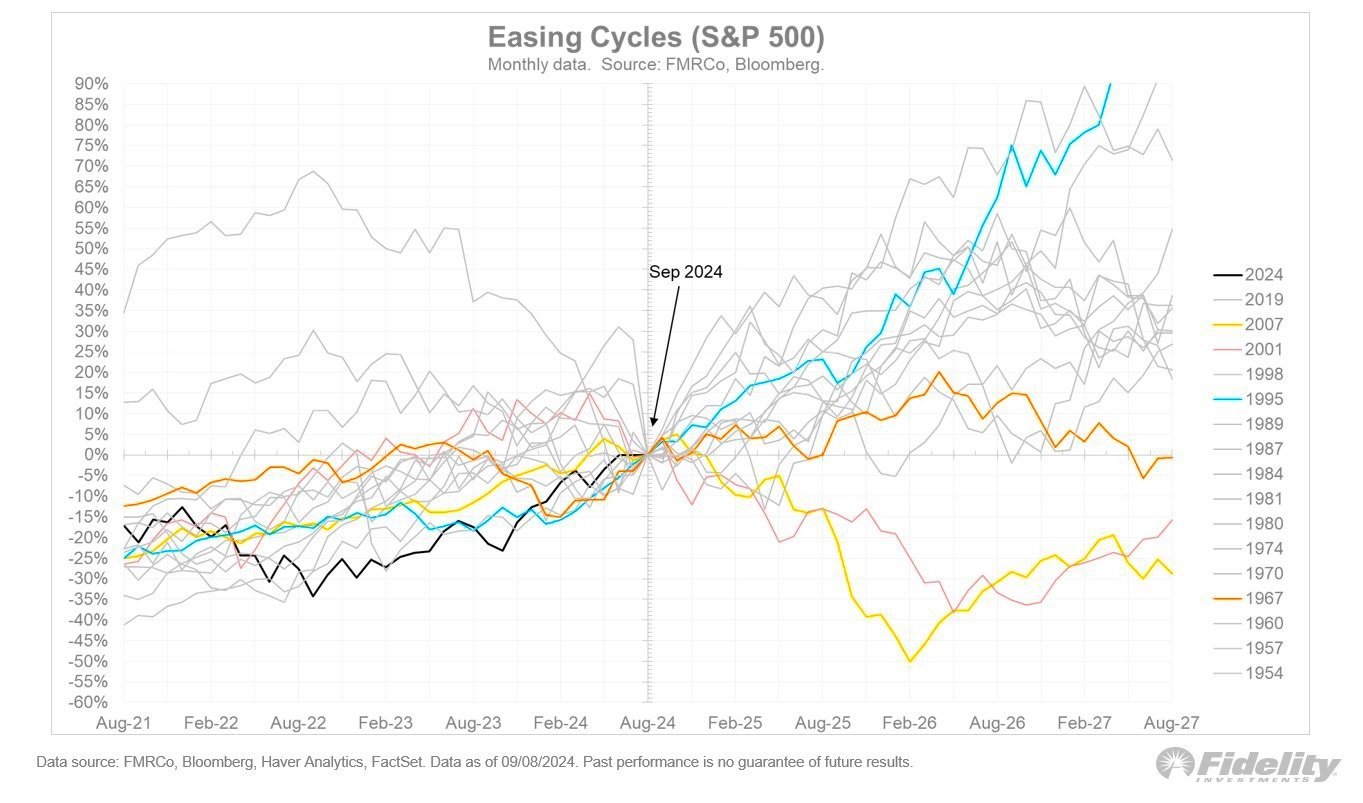
Not to be outdone is Fidelity, with a busier graphic. I’m not sure where it nets out.
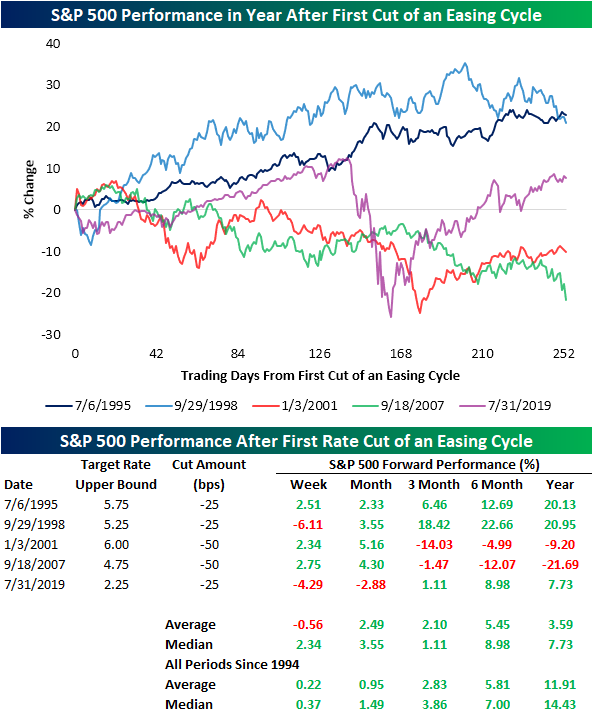
And then Bespoke Investment Group likewise shows that generally, but not always, the S&P 500 has risen following recent interest rate easings.
I don’t think it’s worth the effort to guess which one will prevail.
Perhaps the point is that in the same way that various research outfits cite somewhat different data, the market in real time is a mix of somewhat different expectations.
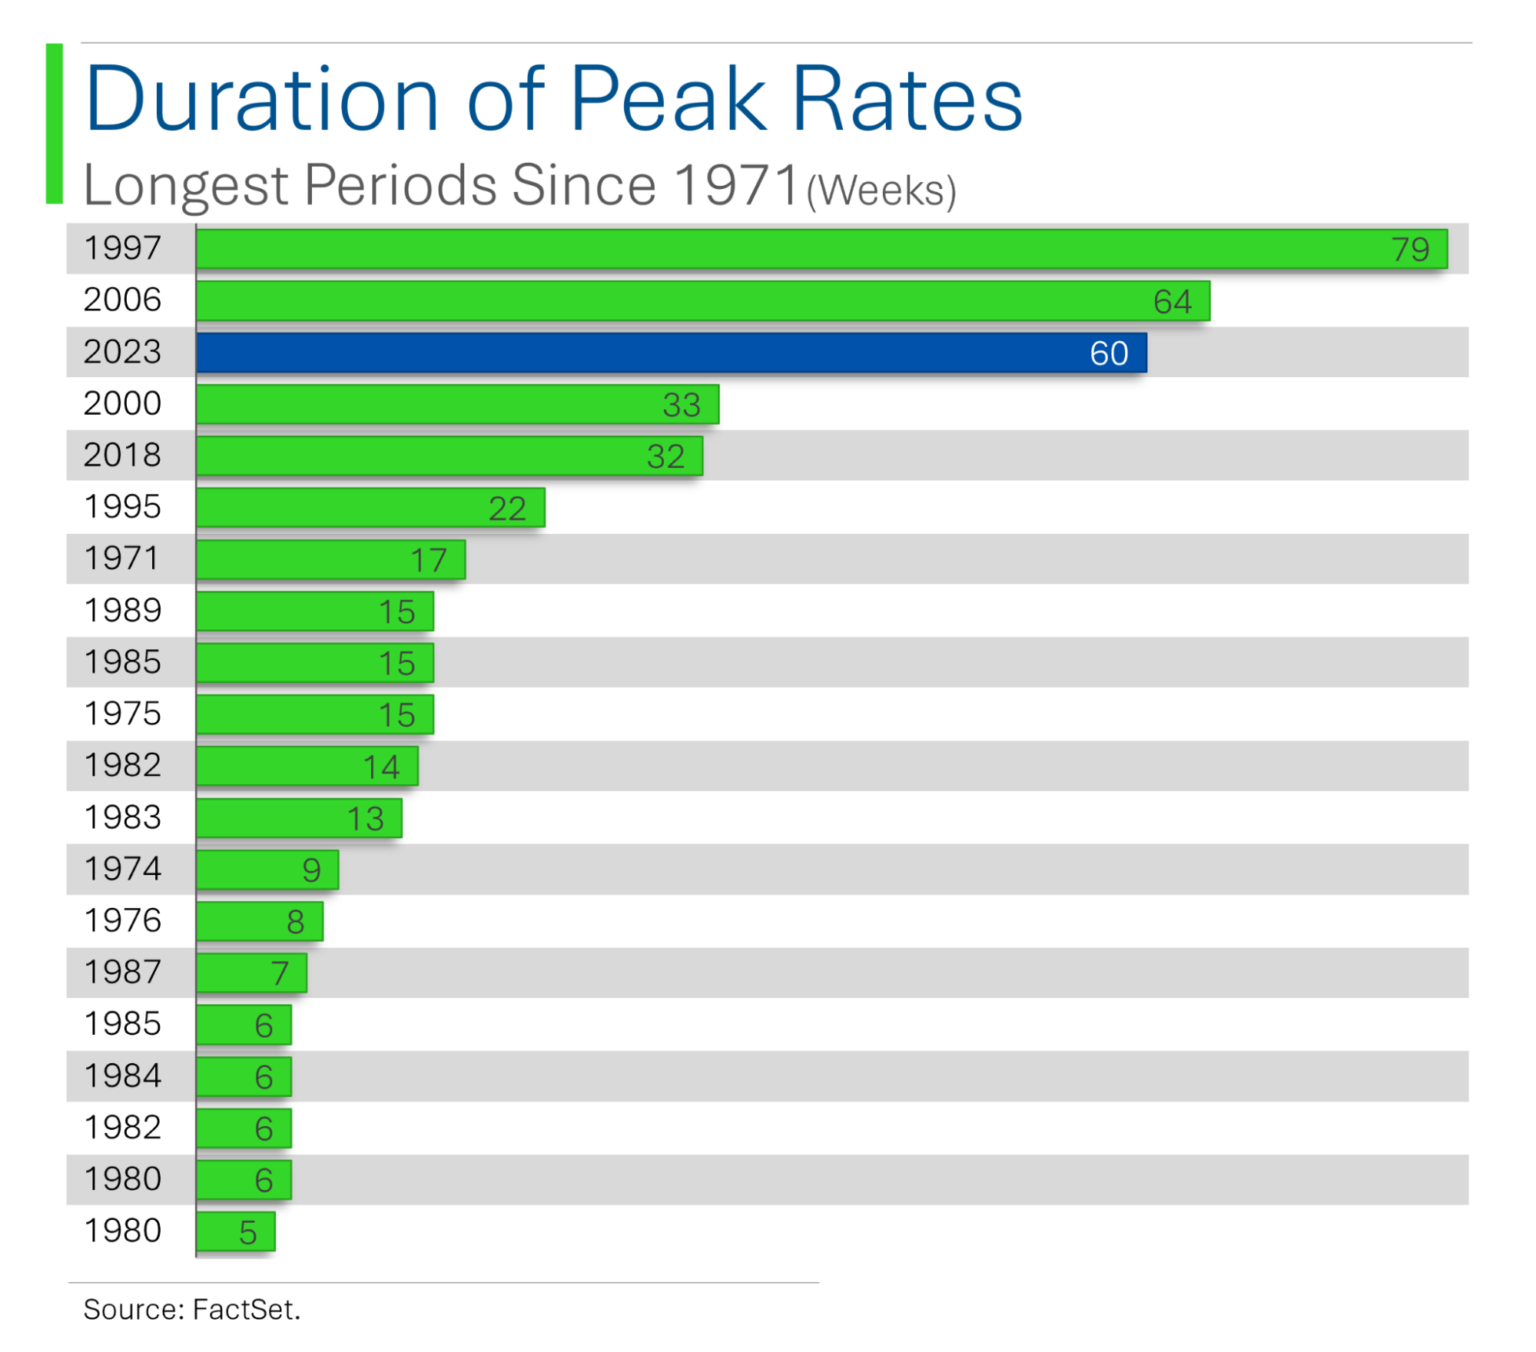
We’ve had a relatively long period of high rates, as the StreetSigns graphic below shows – yet another reason that this time may be different, to echo the idea of normal recession indicators not working now, and a confused market.
Emerging Markets Already Emerged?
If you’ve been investing for a few decades, you remember that at one point, investments were divided into two geographic categories, at least from the perspective of US investors: US and international.
For the most part, the sorts of markets that we call “emerging” now either didn’t have capital markets or had capital markets that were so incipient or so cumbersome for outsiders to invest in that they weren’t realistic options for US retail investors.
Eventually, things changed: We have US, ex-US developed markets, emerging markets, ex-China emerging markets, frontier markets, and probably other striations, too.
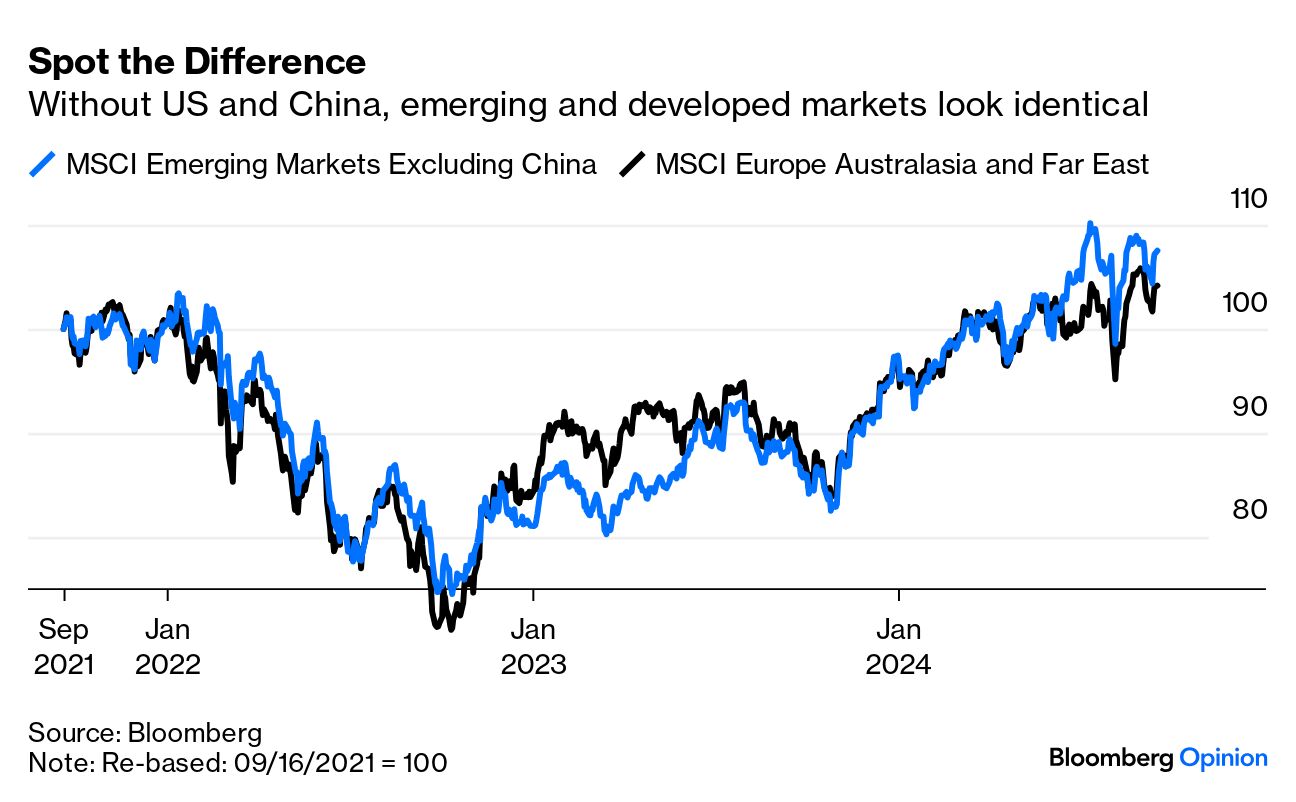
Bloomberg’s John Authers makes an interesting point, albeit with just three years of price data: If you take out the US and if you take out China, the price performance of emerging and developed markets is remarkably similar:
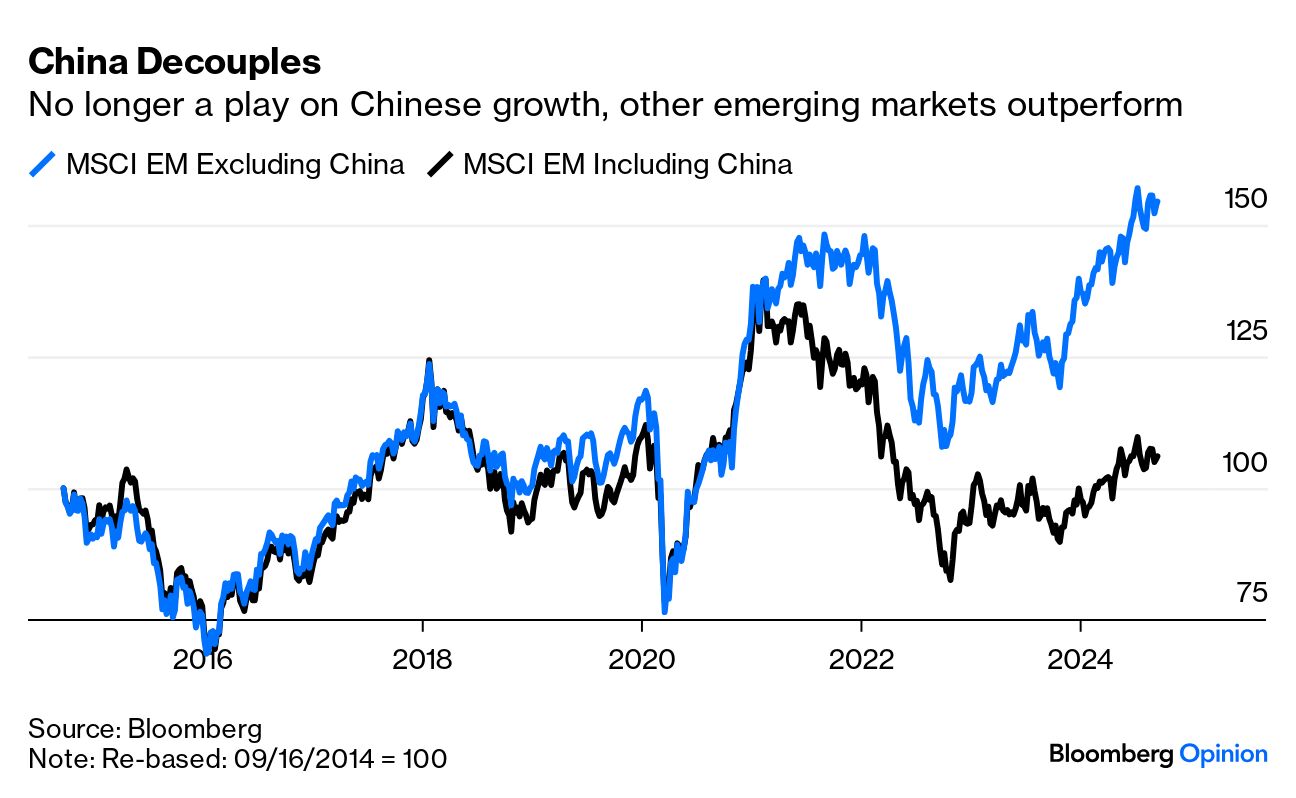
Just to drill home the “China Effect” in particular, see the 10-year chart below: The MSCI Emerging Market Index excluding China started to substantially diverge from the index including China around 2021.
Three years does not a permanent trend make, but the irony is that, at least for the past three years, we’ve come full circle: Emerging markets have emerged to the point that, China aside, we seem to be returning to the era of “US” and “international” being legitimately descriptive geographical asset categories.
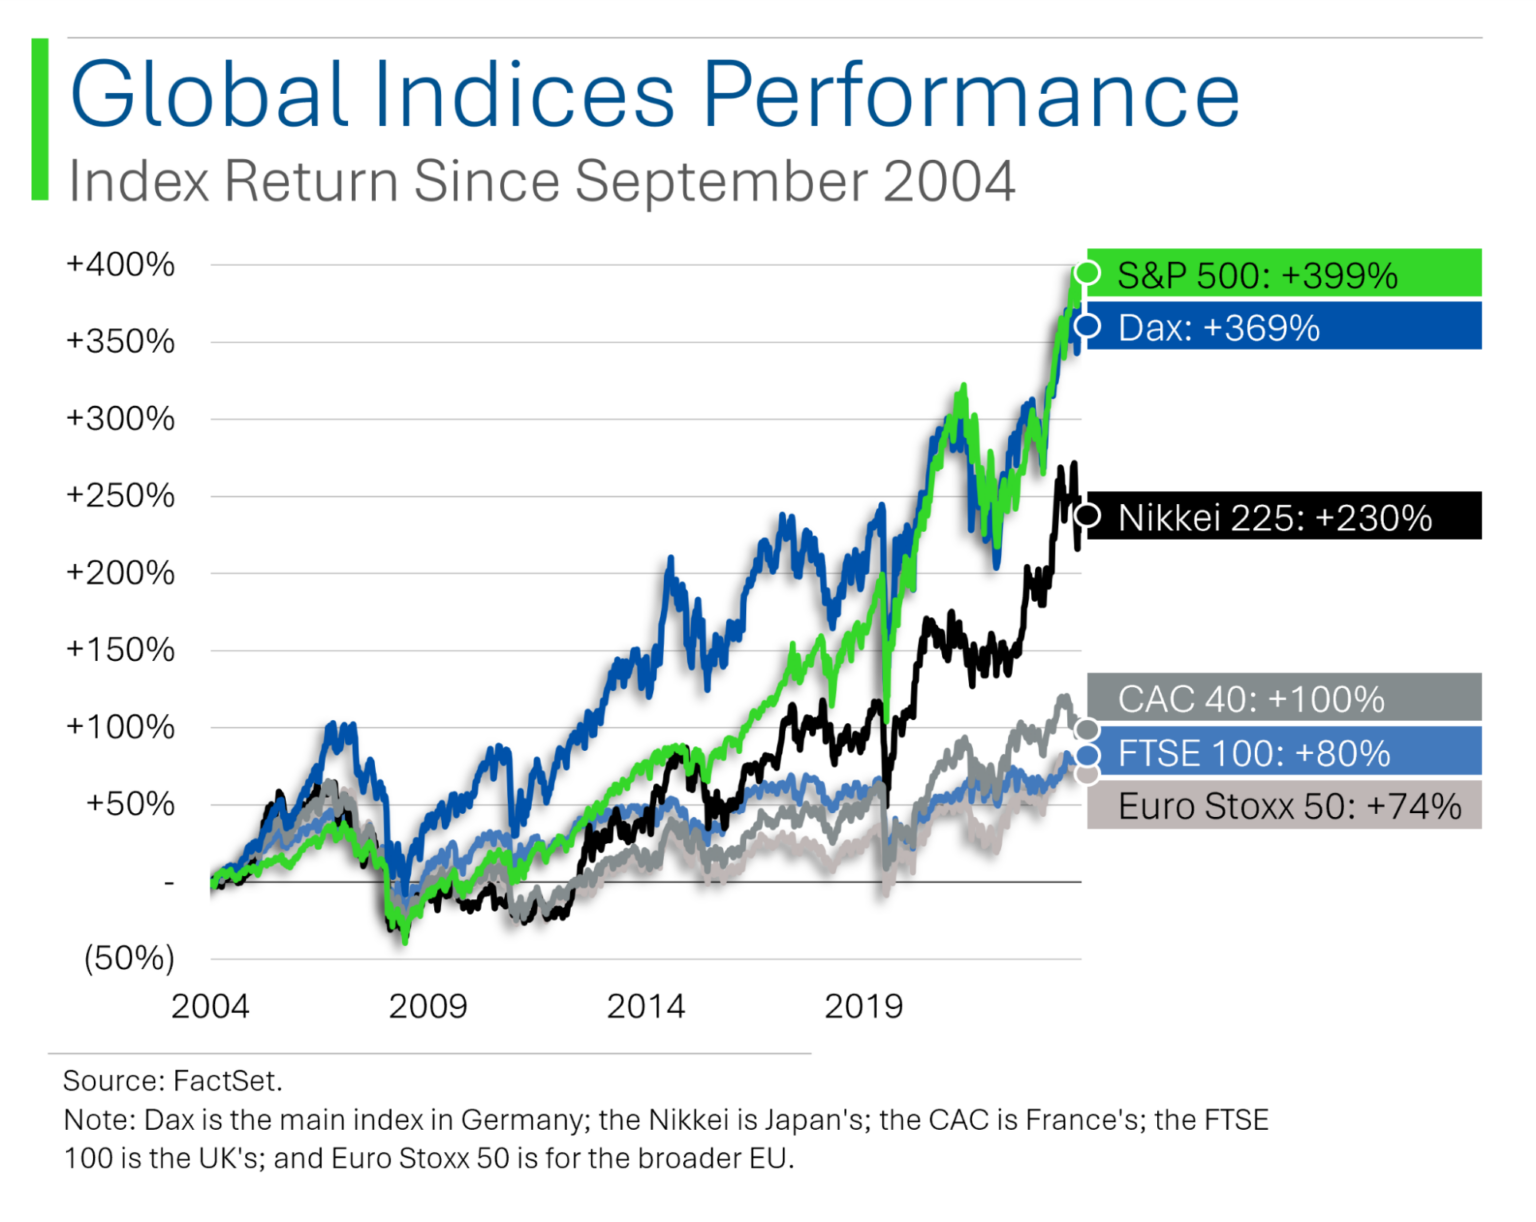
For the past 20 years, though, the US has been the best game in town, as this StreetSigns graphic shows:
Utility Stocks Cheap?
BBAE friend Roger Conrad of Conrad’s Utility Investor says that despite their good performance, utility stocks have more room to run this year.
Now, if you’re a Charlie Munger devotee – “Show me the incentive and I’ll show you the behavior” – you might wonder if someone publishing a product about utility stocks might be biased toward utility stocks. I mean, can you imagine someone running a utility stock service saying: “These next 5 years are going to be dismal for utilities?”
Actually, Roger is shockingly honest about bad periods for utilities. Even better, he has several other dividend-oriented services, meaning all his eggs aren’t in the utilities basket.
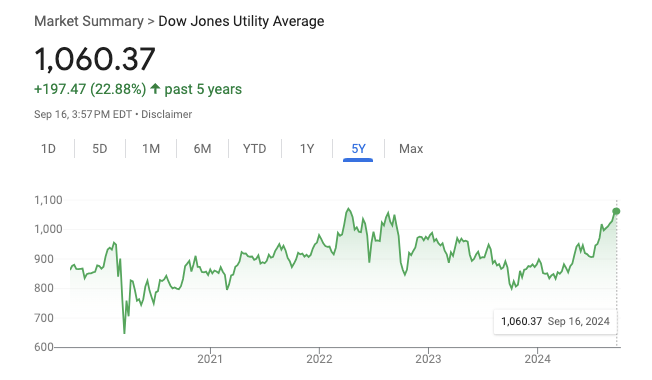
Anyway, Roger notes that while the Dow Jones Utility Index is up 23% year-to-date – outpacing the S&P 500, utilities still have room to run.
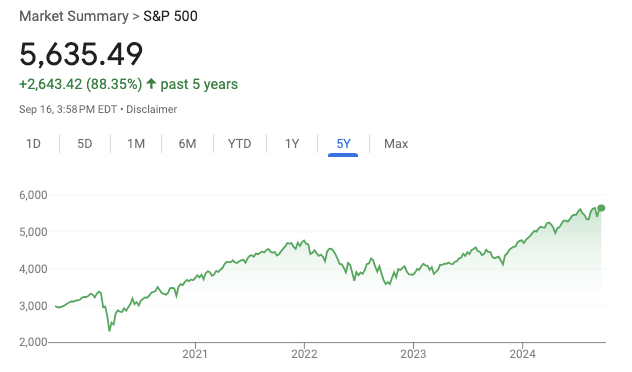
For background, despite a good 2024 so far, utilities have risen far less than the S&P 500 over the past five years:
Roger debunks the notion that utilities do terribly during rising interest rates (though they didn’t do well during this past rate-hike cycle), saying that since World War II, their rising-rate performance was just as good as their falling-rate performance.
Roger attributes the recent rate-hike performance to the hikes coming during a period of major capital expenditure for utilities, making investors worried about utilities taking on high-rate debt, as well as the broader issue of dividend stocks becoming less attractive during higher rates thanks to competition from now-higher-yielding bonds, CDs, etc.
Roger says that the market didn’t adequately notice that utilities were clever to borrow or refinance at lower rates (loading up before rates rose), and that low-cost “green” bonds as well as Inflation Reduction Act credits have let utilities weather the storm better than people expected.
Now, they’re meeting or beating expectations, about to see a lower-rate environment (which is technically supposed to be a neutral, per Roger’s earlier point), and they’re seeing the first meaningful electricity demand growth in the US in more than 20 years.
What should investors do? Roger actually doesn’t think investors should buy utilities in aggregate because there’s not enough upside in the group as a whole (the Utilities Select SPDR ETF (NYSE: $XLU) pays only 2.8%, he notes, which indicates high prices). Rather, he thinks it’s best to cherry pick individual utility stocks.
This article is for informational purposes only and is neither investment advice nor a solicitation to buy or sell securities. All investment involves inherent risks, including the total loss of principal, and past performance is not a guarantee of future results. Always conduct thorough research or consult with a financial expert before making any investment decisions. Neither the author nor BBAE has a position in any investment mentioned.