

News Roundup: US Stocks en Fuego, Best & Worst Stocks, High PE Revenge, China’s Anticlimactic Stimulus
US Stocks Are Rocking
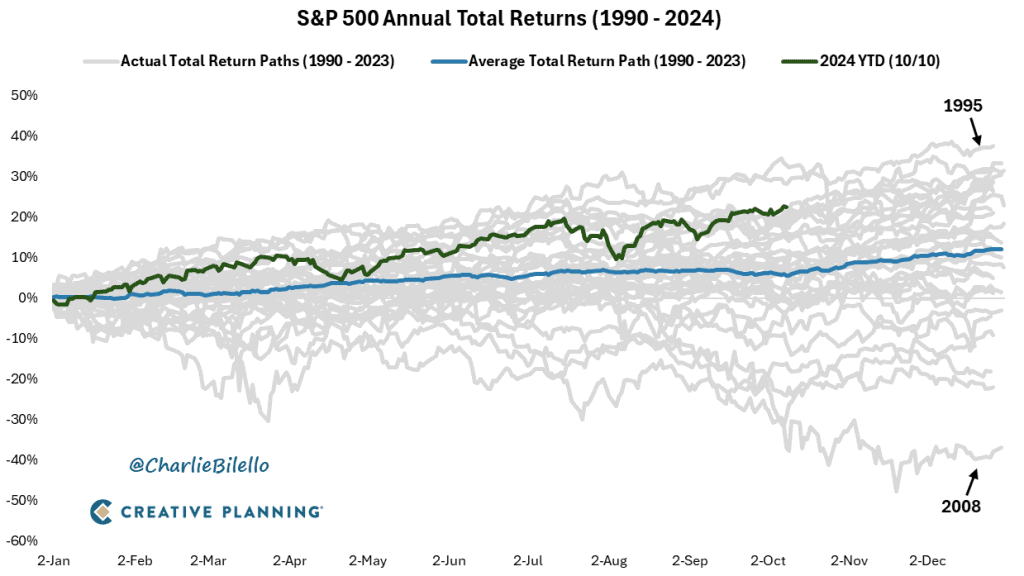
Charlie Bilello of Creative Planning puts how well the S&P 500 is doing so far in 2024 into perspective with some great stats and charts. For instance, per Charlie:
- “The S&P 500’s 21.9% year-to-date gain is the best “start” [quotes mine -JE] to a year since 1997 and 13th best in history.”
- “We’ve now seen 45 all-time closing highs in 2024. And there’s still two and a half months to go.”
It’s really amazing – and I’m not complaining. For another visual, Charlie shows the below – note the partially completed dark green-ish (to my eyes; maybe it’s brown to someone else’s) line that represents 2024, and the blue average line below:
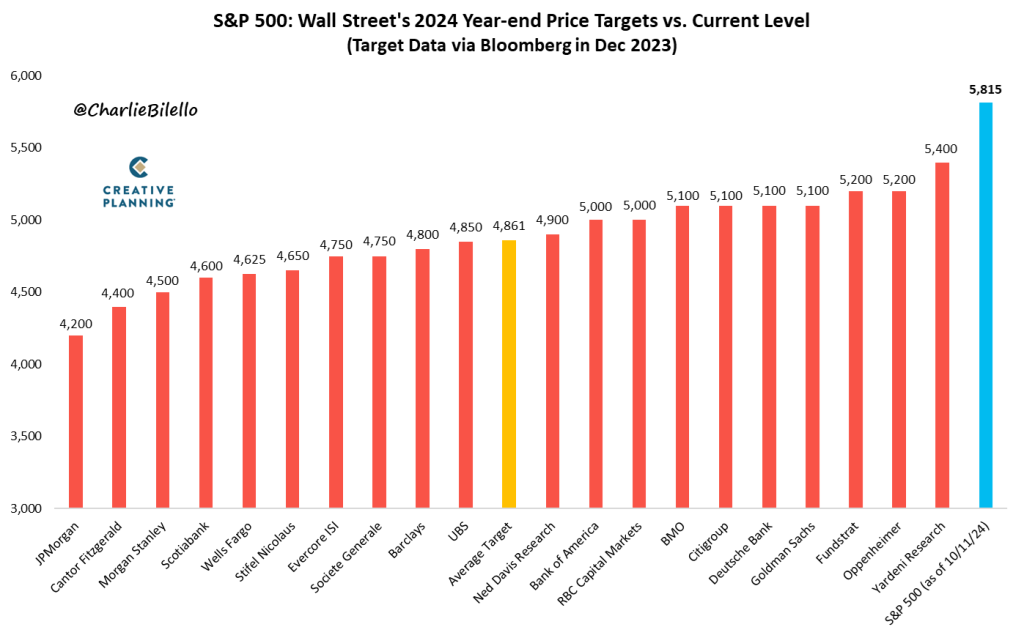
Now I remember giving a presentation last December and pointing out how wide of a spread Wall Street predictions were for the S&P 500’s 2024 performance. If I recall correctly, I pointed out how wrong the Wall Street predictions for 2023’s S&P 500 performance had been.
Fair question: Are predictions just mental itch-scratchers?
History may usually rhyme instead of repeating, but in the case of Wall Street analysts being wrong about predictions, history is pretty close to repeating.
Being in the market for a few decades now, I have to say: It’s really hard to make the case for the value of macroeconomic predictions. I’m not saying it can never be done. I’m not saying there’s isn’t huge demand for it – in fact, there’s enormous demand for it, which is part of the problem.
The human mind depores ambiguity, and the social sciences like economics are filled with ambiguity, which prompts our noggins to place a disproportionately high psychic value on predictions as itch-scratchers, whether accurate or not.
For something more positive, our reliable Ryan at MarketLab has produced a graphic showing that, technically, our little recent bull market is not long in the tooth at all – at least technically:
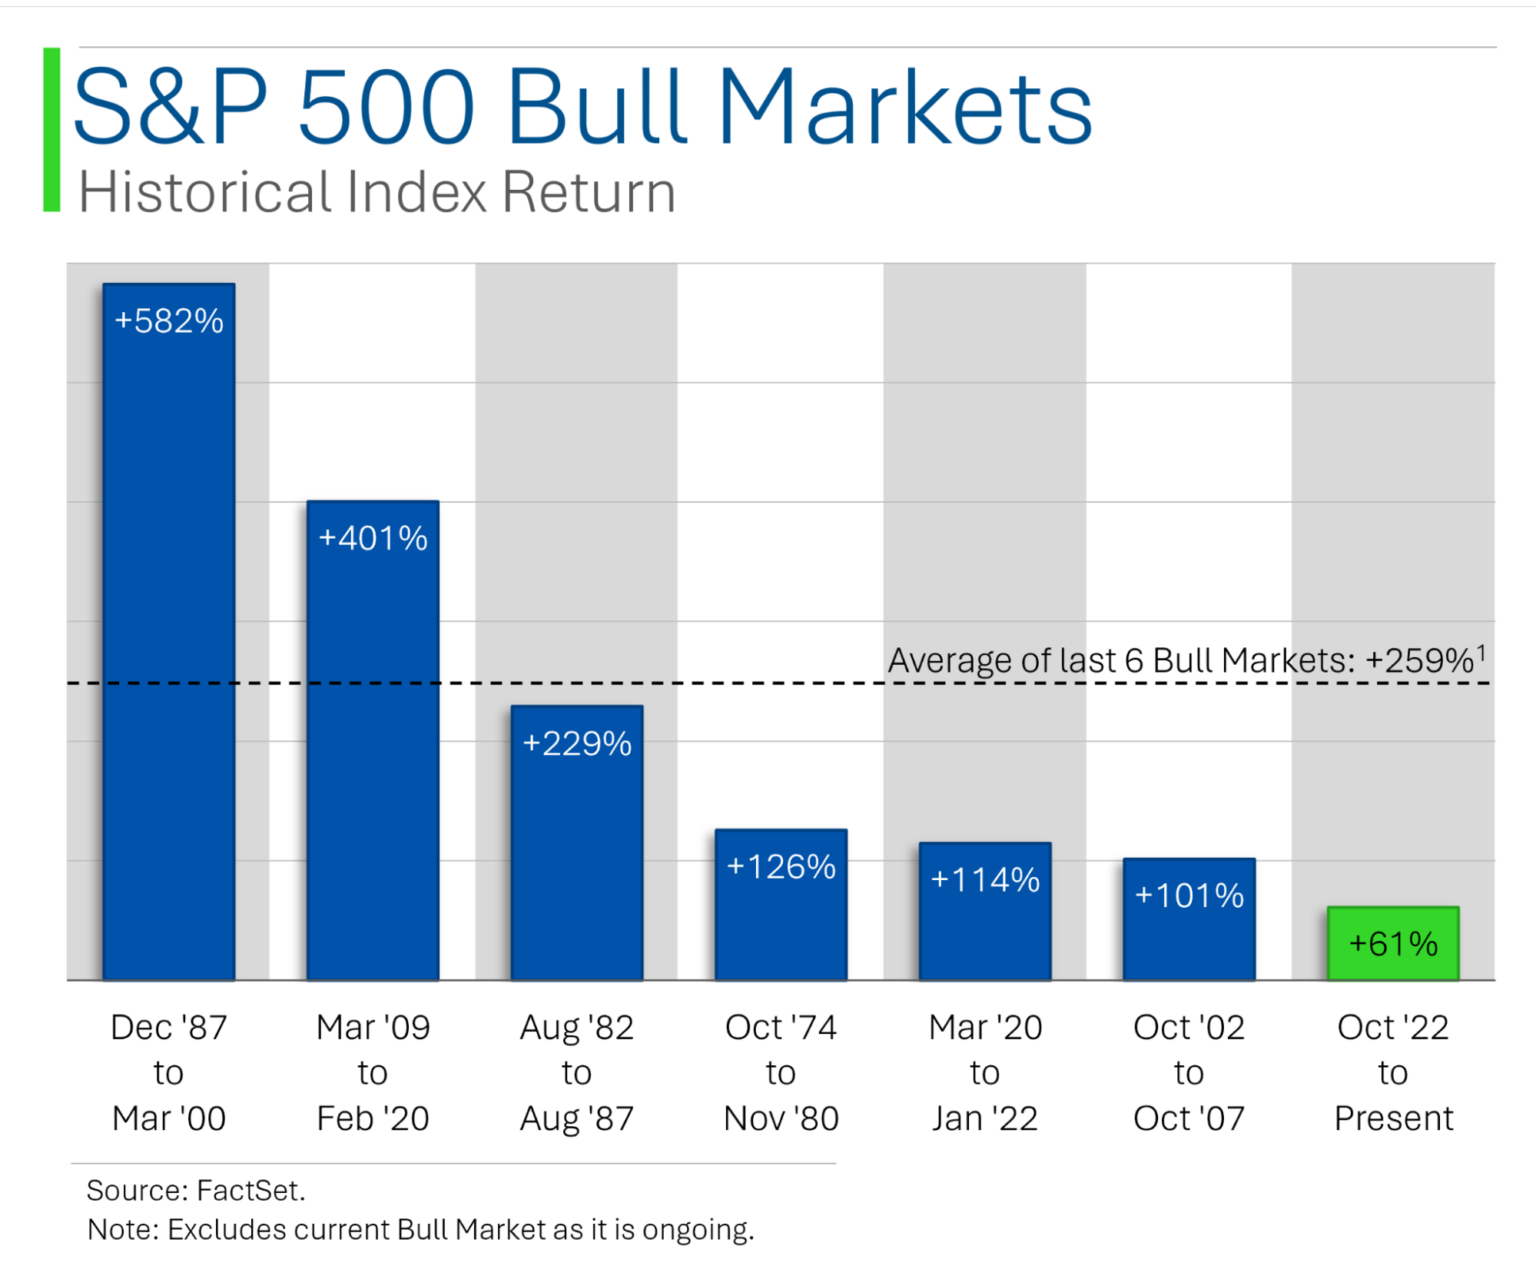
I say technically because one could argue that things have been broadly bullish since 2009, save for a brief COVID dip and a rough 2022. One could go further and argue that things have been broadly bullish since 1982, save for a few recessions here and there – the US hasn’t had a prolonged flat market in a while.
The retort is that exceptionalizing (is that a word?) “brief” recessions is missing the point, because the average post-WWII recession has lasted just 10 months, which is fairly brief. In other words, recessions are usually shorter than we’d think.
Any Lessons from the Best and Worst Stocks of the Past 2 Years?
One upside to Bespoke Investment Group’s decision to start sending me unsolicited stuff is that, to be fair, it’s good stuff.
And I took a surprising non-lesson from a list of the best and the worst S&P 500 performers over the past two years.
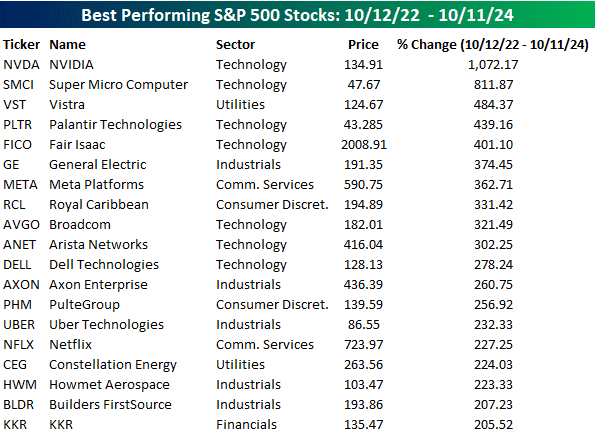
Have a look at each, and then we’ll talk more. Here are the best performers, and it will surprise exactly nobody to see that NVIDIA leads the race (even though independent power producer Vistra (NYSE: $VST) is actually the best S&P 500 stock of 2024):
And here are the worst performers:
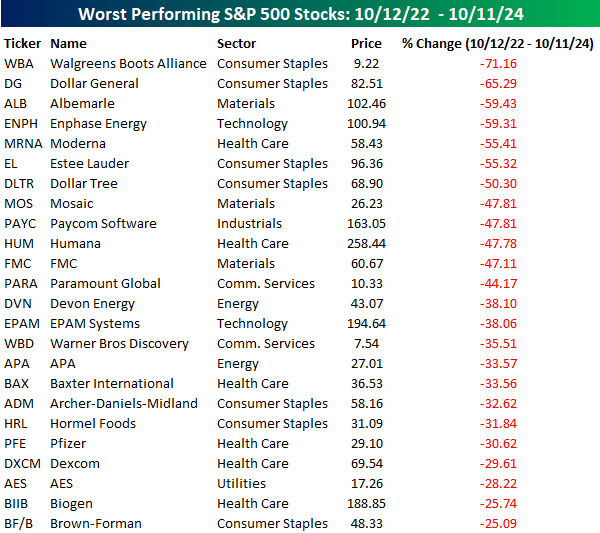
What’s the non-lesson? It’s how diverse each group is. Neither group is totally diverse: There is a concentration of AI-driven tech stocks in the winners, and a concentration of boring, inflation-eating consumer staples stocks in the loser’s bin, along with health care stocks.
(Note that some of the sectors seem a bit off; I’d call fintech payroll company Paycom (NYSE: $PAYC) – which Emmet Savage of MyWallSt recently pitched in a BBAE interview – “Technology” instead of “Industrials,” homebuilders tend to be their own industry (versus “Consumer Discretionary”), and I’m not 100% sure that a company called Uber Technologies (NYSE: $UBER) is an industrial, for example.)
But, overall, the winners and losers were more idiosyncratic than I’d expect. For this reason, I’ve always been a far bigger fan, from the perspective of long-term investment, of finding great companies rather than great industries.
First, I think it’s a lot more durable (great industries ebb and flow), and second, many “great” industries are actually not great at all on the individual level: They’re pulled up by one or a few great companies that generate sufficient returns to mask legions of underperformers. More than 2,500 US car companies have come and gone, and we’ve got just a handful of publicly traded car companies now. Has the car industry been a great industry? Not for most investors. But there have been a few great car companies for investors.
High P/E Stocks: Where Are They Now?
In 1994 an academic trio of Josef Lakonishok, Andrei Schleifer, and Robert Vishny (I’ll call them “LSV” because that’s what everyone else calls them) published one of the most-cited pieces of investing literature: Contrarian Investment, Extrapolation, and Risk.
In what ended up being a nod to value investing, LSV broke stocks, using data from 1963 to 1990, into deciles, or groups of 10, according to two criteria:
- P/E ratio (technically, E/P, which academics use more commonly, but “P/E” absolutely captures the idea)
- Historical sales growth
Their findings?
- The lowest P/E decile beat the highest decile by 4 percentage points per year
- The lowest trailing sales growth decile beat the highest by 7.3 percentage points per year
- A combined “value” portfolio of the lowest P/E and slowest sales growth beat a “glamor” portfolio of high P/E stocks and high sales growth by 11 percentage points per year(!)
In a world where outperformance is sometimes measured in decimal points, 11 full percentage points every year (on average) is outright amazing.
But what a difference near-zero interest rates make!
Trusty Ryan at MarketLab (who is at least trusty in reliably putting out informative graphics) more casually looked at the highest P/E stocks from 2014, using forward P/E instead of the more common historical P/E. He first found that for most, their multiples (their P/E ratios) had compressed:
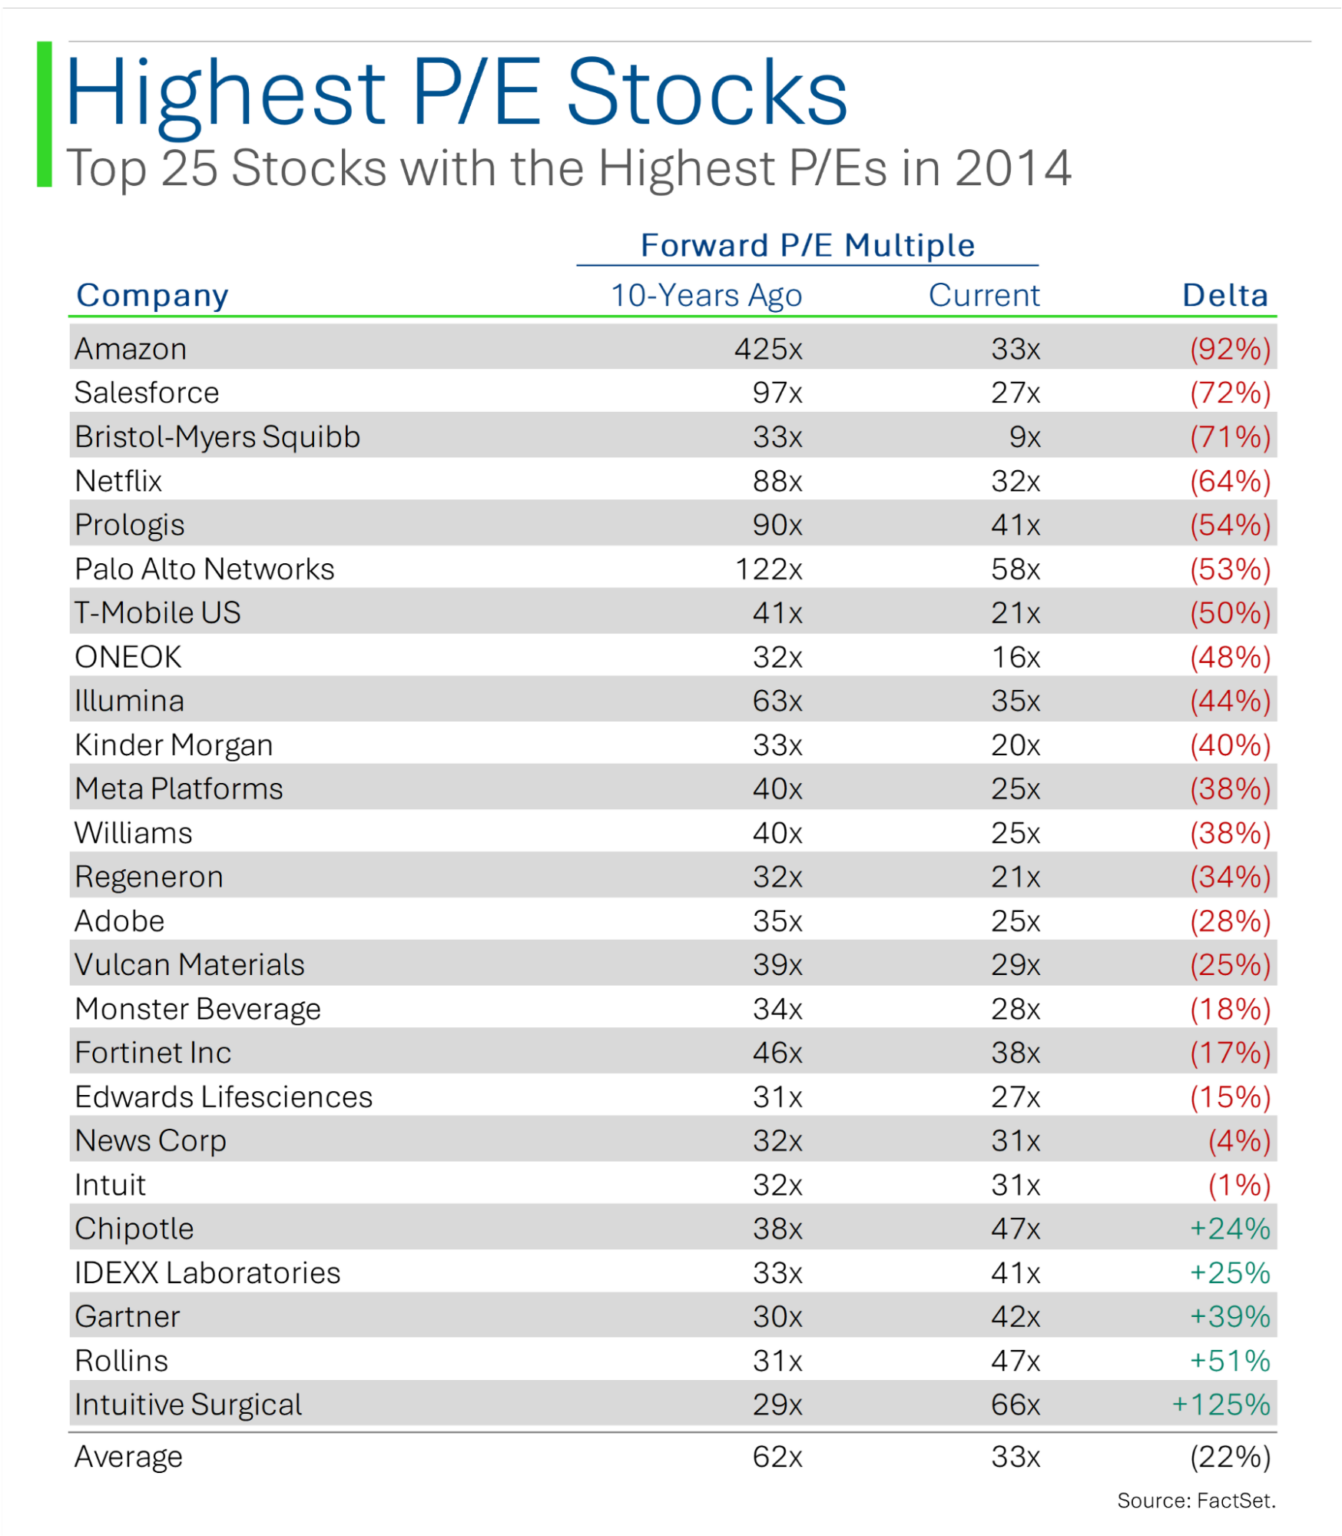
This makes sense, as trees don’t grow to the sky. But what’s interesting is that Ryan found that for the past 10 years the high-P/E average return was actually better than the average-P/E stock return: 13.4% versus 8.8% annually.
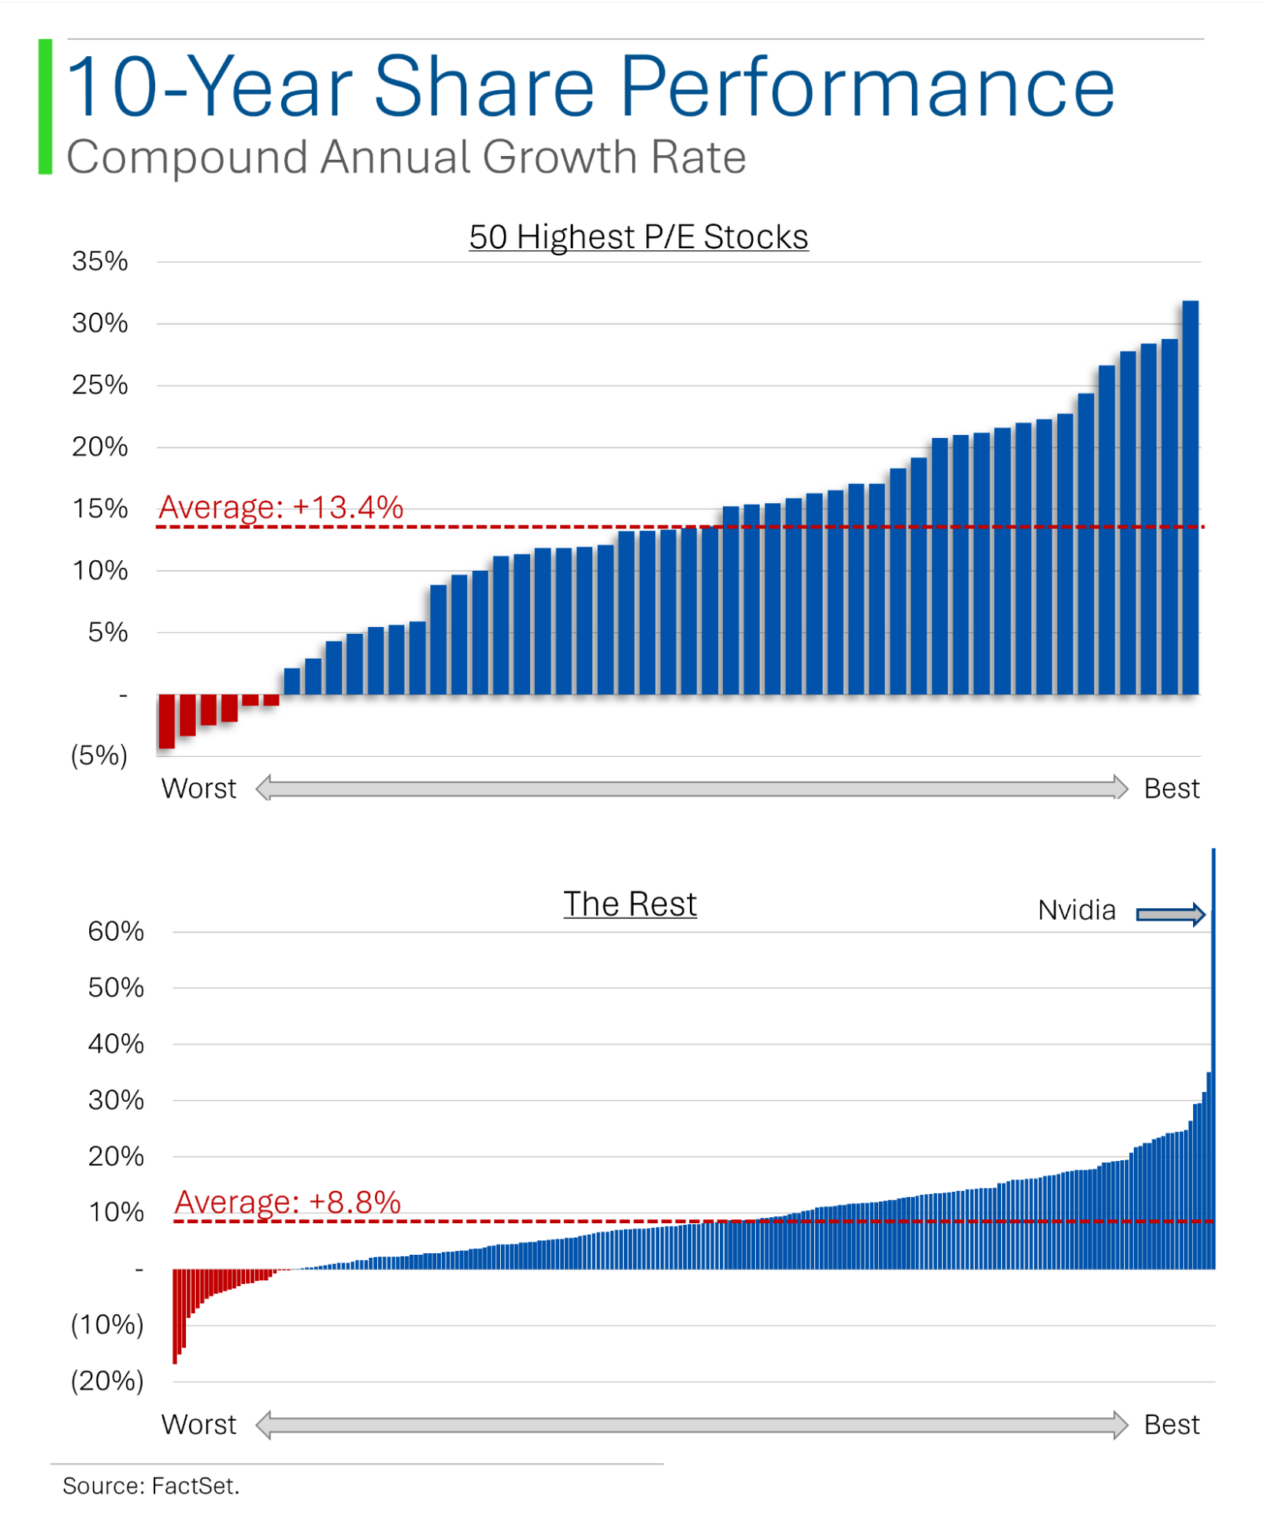
So LSV’s findings aren’t always right.
China stimulus disappoints markets – but is more to come?
The hardest thing about economics is that it’s a social science.
By all measures, China’s economy and stock market have not been doing well lately. A monetary stimulus announced September 24th boosted Chinese stocks – briefly. China tends to be a government policy-driven market, so this pattern is typical: Investors trade the momentum of the latest positive announcement, but after a spike, prices come back down.
But prices did not come back down all the way, because investors were expecting more stimulus to follow – specifically, fiscal stimulus to complement the monetary stimulus (fiscal stimulus generally relates to taxing and spending, and is generally the provenance of country’s finance ministry, whereas monetary stimulus relates more to interest rates and loans, and is generally handled by a country’s central bank).
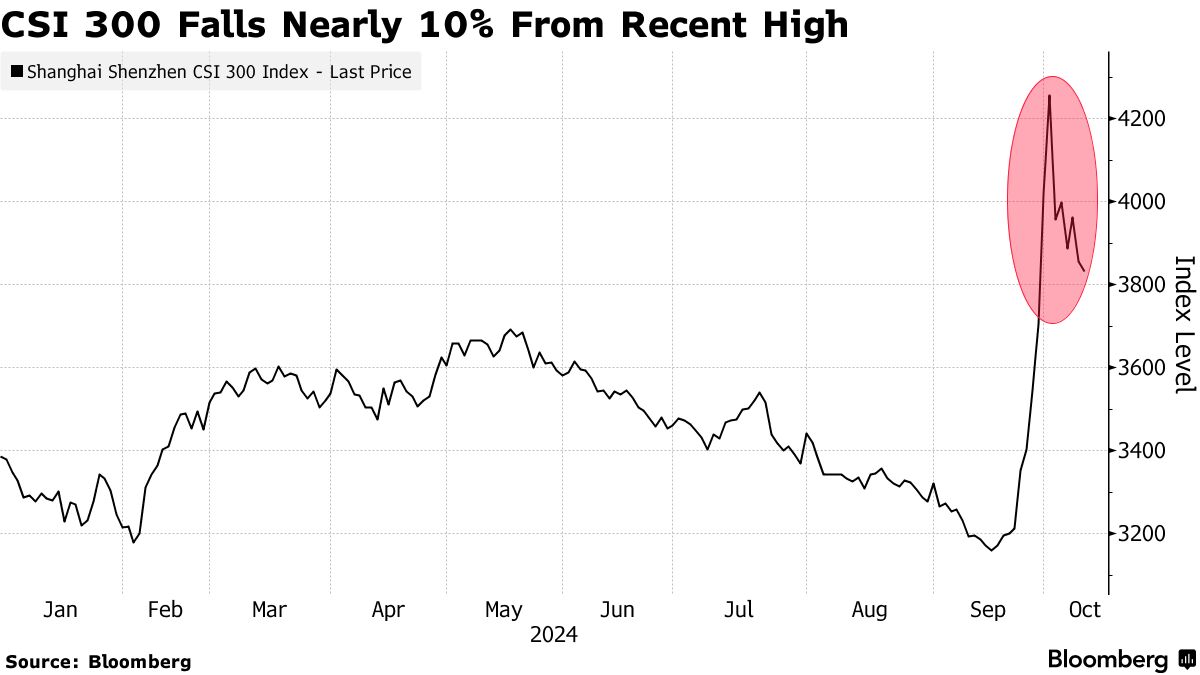
Leading up to this past weekend’s announcement, investors were hoping for a fiscal bazooka of anywhere between RMB2 trillion stimulus and RMB10 trillion (about US$1.7 trillion).
The market found the announcement itself anticlimactic and lacking specificity, and Chinese stocks have declined since, but rumors have just surfaced that an RMB10 trillion package is in the works.
Will it work? A federal government can most easily help provincial and local governments. And probably state-owned companies. There’s less social science to those. But while it’s one thing to force banks to make attractive loans and spending incentive-type programs (like Cash for Clunkers in the US) available to the populace, it’s another thing for the populace to actually decide to make use of those loans and programs. In a country that’s both struggling with consumer confidence and traditionally had a 40%-50% saving rate, uptake isn’t a given.
The positive view is that the government is changing its tune and finally making a big show of effort to support its markets and economy. There’s a lot of good in that signaling from a social science perspective. Our friend Carlos Diez of MarketGrader (see BBAE’s MarketGrader portfolios here) largely makes this argument in his article, in which he says that at least the government’s new intent is clear and “scaffolding” is being established for future support.
The negative view (if you want a particularly negative view, watch this video) is that even in China, where the government has tried previously to tamp down its property market and is now trying to amp it back up, it’s still not easy for a government to force consumers to be more confident – in the long run, China’s economic success hinges on more consumer spending – or compel would-be borrowers to borrow. You can lead a horse to water, but you can’t make him drink.
We’ll see which view prevails.
This article is for informational purposes only and is neither investment advice nor a solicitation to buy or sell securities. All investment involves inherent risks, including the total loss of principal, and past performance is not a guarantee of future results. Always conduct thorough research or consult with a financial expert before making any investment decisions. Neither the author nor BBAE has a position in any investment mentioned.