
BBAE Basics: The PE Ratio
If you’re new to investing, one of the first buzzwords you’ll hear about is the price-to-earnings ratio, or P/E (or PE) ratio.
PE ratio = stock price / earnings
You might quickly search and see that, per the above formula, this ratio divides a stock’s current price by the company’s trailing-year earnings.
But, my friend, if you stop at the formula, you’re missing a lot.
Too much, in fact. Let’s see why.
The PE ratio: the “fast food” of valuation metrics
The PE ratio is a valuation measure – it helps tell us how “cheap” or “expensive” a stock is. (A $5 stock is not cheaper than a $500 stock per se – what matters is how much business value you get for whatever price you pay.)
When you sell your house, valuation is easy: You likely have prices of comparable houses to extrapolate from. Ditto for rare coins, comic books, and the like.
But unlike houses, companies come in wildly different sizes.
So, one way to price them is on a per-unit basis.
If you’ve bought things like cheese, shrimp or apples by the pound at the grocery store, or rope by the foot at Home Depot, you understand per-unit pricing. (Ditto if you live in a state that charges you incrementally per mile above the speed limit you were speeding on tickets.)
So if a company’s stock price is, say, $57 per share, you could conceivably compare it to a variety of numbers on a per-unit basis:
- Revenue per share (presumably the trailing year’s, although a solar rotation is arguably arbitrary for a going-concern business), which is terrible in that it completely ignores the company’s cost structure and debt level. Revenue comparisons are acts of desperation – used because a company has no profit numbers.
- Earnings per share, which makes sense in that companies are primarily in business to make profit for equity owners.
- Cash flow per share, which makes even more sense if you believe accounting rules distort earnings, but which is computationally inconvenient.
- Assets per share, which, aside from ignoring liabilities per share, makes some sense in a salvage value situation, or for a company (like a royalty trust) that mostly has value by virtue of owning a lot of gold, oil, or similar asset, but which doesn’t make sense for most companies because it ignores future earnings – the main (conceptual) source of value for equity investors buying now.
- Book value per share, which is more holistic than assets, but which, for accounting reasons, tends to be wildly inaccurate for any companies aside from financial companies, who use mark-to-market accounting for their assets and liabilities.
For the sake of completeness, you could compare price to goofy things, too, like employees per share, square footage of warehouse space per share, etc., but earnings per share is the most convenient for balancing sensibility and ease (almost every SEC-filing data feed spits out earnings, whereas cash flow needs to be calculated, often with a few quirks adjusted for).
Note that multiples can be used in aggregate: Market cap could be compared to total company earnings. Same idea as per-share PE.
PE answers the question: For every $1 in stock price I pay, how much in last year’s earnings do I get?
I say “fast food” because the more conceptually proper way to value a company is a discounted cash flow model – generally what the hedge fund and mutual fund pros, as well as Wall Street analysts, use. But like going to McDonald’s, using multiples like PE is much more convenient, even if it’s not the best thing for you, so in practice, multiples are the primary way the world values stocks.
Downsides of PE
- PE uses prior earnings
When you buy a stock, you are conceptually buying the rights to the future earnings (or cash flows) of the company. From this lens, the company’s past is like a great big sunk cost: Because you’re not buying it, it doesn’t matter, aside from its ability to help predict the future. Last year’s earnings already happened, and in an abstract conceptual sense, belong to whoever was holding the stock last year, and not you.
Incidentally, those prior earnings could be up to three months delayed for US public companies, which file quarterly results, and even more delayed for some Asian or European companies, which file every six months.
- PE uses only one year* of results
It could be compellingly argued that, because a company is an ongoing entity, basing its entire valuation on a single year of results is semi-ridiculous. Cyclical companies, for instance, may have several good years and then several bad years. A company that just did a merger may have restructuring charges that temporarily depress results, and a company that recognized a one-time windfall may have near-term results that would be unrealistically favorable to project into the future.
*the “one year” concern does not apply to balance sheet denominators like book value or assets
- PE uses accrual earnings
I don’t like to pick on accounting standard setters, because they’re trying, and there’s no perfect solution, but it’s also true that while accrual accounting standards (whether GAAP or IFRS) attempt to better capture economic reality than cash accounting, sometimes they simply don’t.
And sometimes they’re just weird: FAS Topic 820 (formerly FAS 157-9), for instance – called the “fair value option” – allows companies (and it’s usually financial firms that do this) to adjust for the fair value of the debt they owe in earnings. For example, if a company recently became sketchier – i.e., a worse credit risk – and its debtholders noticed and the price of the company’s debt declined (because of a lowered chance of full repayment), thanks to Topic 820, the now-sketchier company gets to add that the amount its fair value of debt was lowered by to its earnings (with the logic that it statistically has less debt to repay, even though it’s supposed to repay it all). So its earnings look better, at least partially, because its future earnings prospects got worse. Weird, right?
This works in reverse, too: A fair-value-choosing company whose debt increases in value because it becomes more creditworthy must deduct the increase in debt value from its earnings.
- PE needs an “E;” it’s useless with companies that aren’t making positive earnings
Many early-stage public companies in the US don’t yet earn money. Without a positive denominator, this fraction doesn’t work.
- PE doesn’t tell you about future growth (or decline)
This is related to numbers 1 and 2: PE is a rearward-looking metric and what you care about is the future. Some investors compare the PE ratio to the company’s expected growth, creating what’s called a PEG ratio. A company with a PE of 20 and expected next-year growth of 10% would be said to have a PEG of 2, for instance (PEGs below 1 are generally considered “cheap”). But PEG is faulted for comparing a regular or “linear” function (PE) with an exponential function (growth rate); it’s thus slightly impure mathematically, and blows up when there’s a large difference between the numbers.
Some of these other downsides can be compensated for; I’ll explain shortly.
How to use PE
If you remember anything about valuation, remember this: It’s all about comparison.
The two basic ways to compare PE (and any multiple):
- To the company’s prior multiple history. For instance, if a company usually trades at a 20 PE and now it’s at a 10 PE, it’s trading more cheaply. This doesn’t necessarily mean you should buy it, but it’s one data point indicating a cheaper valuation.
- To the company’s peers. Defining “peers” is sometimes easy and sometimes hard. And you could combine these concepts by looking at historical peer group multiples, too.
The S&P 500’s median multiple is 15, and its average is about 16.
Per the Multipl.com chart below, the S&P 500’s PE was 29 when I wrote this. That’s high, but as I mentioned in a weekly roundup recently, some analysts feel that today’s market – which has stronger companies with lower fixed costs and less debt than in times of yore – deserves a permanently higher multiple, although perhaps not twice the long-term average.
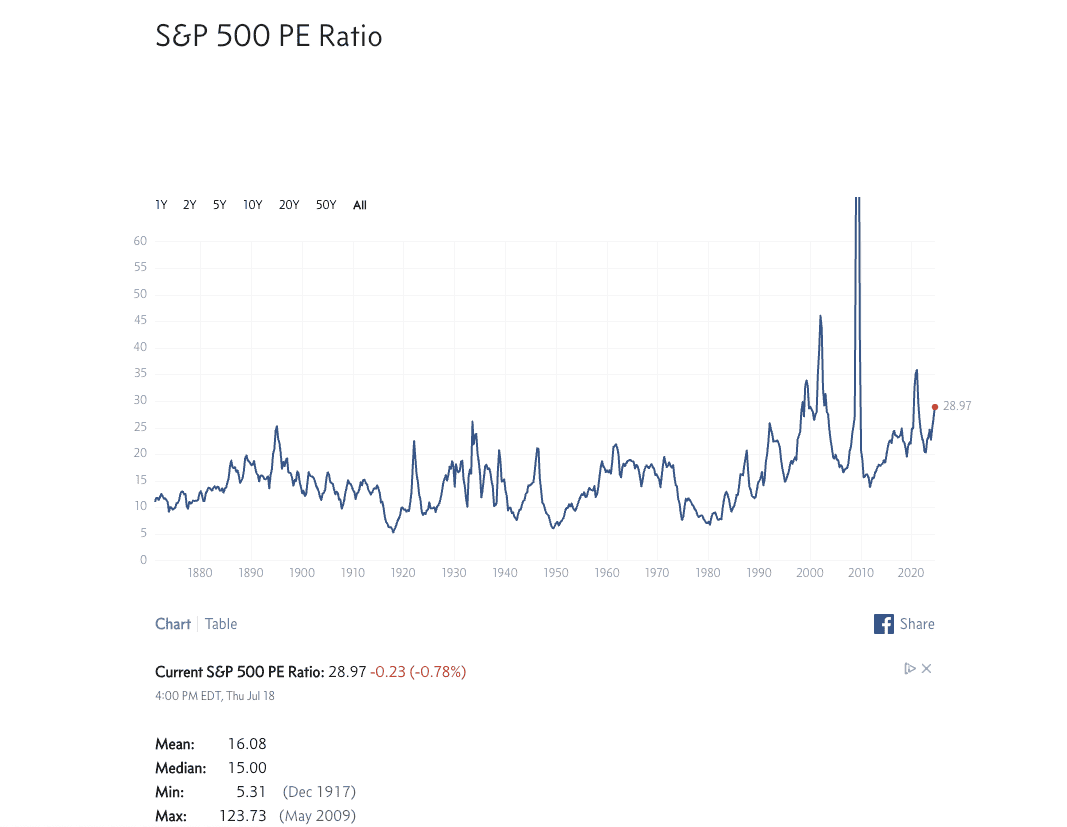
You can’t help but notice the blip in 2009. It looks like stocks momentarily got super expensive, but the blip is actually more a reflection of a deficiency of multiples combined with the intelligence of the market.
In the 2009 Global Financial Crisis, stocks dipped, but earnings dipped even more. This makes the quotient of the fraction look high. But in practice, investors were level-headed and forward-thinking enough to know that the bad times would pass, and so they didn’t “punish” company stock prices as much as they could have had they been mindlessly investing only based on multiples of trailing-year earnings.
How to adjust for PE’s weaknesses
Investors can’t fix all of PE’s woes, but they can improve the “just one year” issue, as well as the “rearview mirror” issue:
- Shiller PE makes PE multi-year: Yale economist Robert Shiller created the “Shiller PE.” which is also called the cyclically adjusted PE, or CAPE. This PE aspires to smooth out cyclicality by using the average earnings over the prior 10 years. It also adjusts for inflation. Academic evidence shows that it’s a better PE to use for stock investors, but one limitation is that it requires 10 years of trailing earnings in the first place, so it isn’t a fit for new companies.
Per Multipl.com, the current Shiller PE ratio, incidentally, is 35.8, against a median of about 16 and an average just north of 17. You could calculate Shiller PE manually, but it would take some time; most investors rely on some data platform for it.
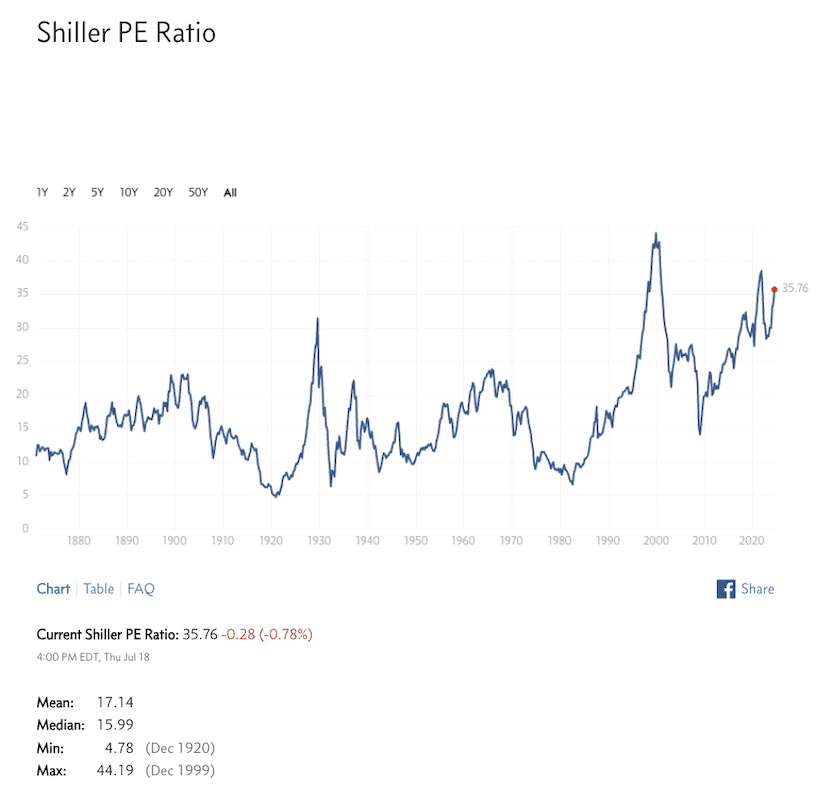
Source: Multipl.com
- Forward PE: If it doesn’t make sense to use earnings that already happened, why not use next year’s earnings instead? You care much more about them anyway. Well, one problem is that next year’s earnings haven’t happened yet. So you, or somebody else, has to estimate them. Pragmatically, few individual (or professional) investors estimate this themselves: Most just use Wall Street analyst consensus estimates.
You’d use an annual or annualized number in either case, but to be wonky, there are actually two ways of doing this:
- You could use consensus estimates for the next year (red highlight below; and technically, you’d multiply the actual most recent earnings by this 1 + this growth rate to get your forward PE denominator)
- You could use the annualized estimate for the overall growth rate for the next five years (blue highlight below)
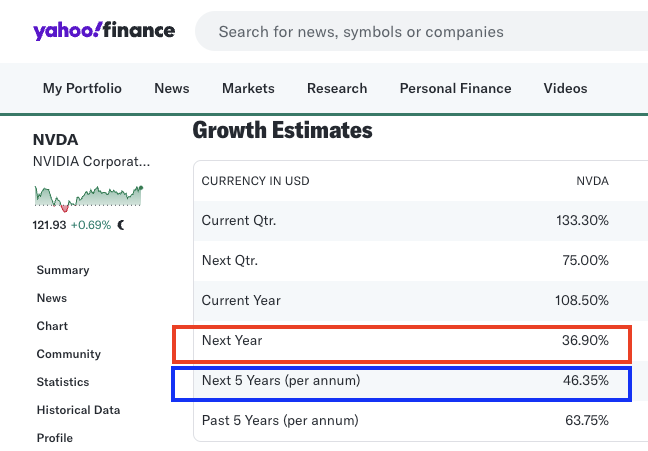
The argument for the next year-only rate is that it’s more likely to be accurate, whereas the next five years is a wilder guess. Conceptually, however, the next-five-year number is better aligned with your motives, in that you’re presumably buying the stock to hold for many years, and thus should technically care more about that number.
I’d say use what you can find, which may be both. A multiple like PE is just one data point. Don’t put too much faith in it. If you’re at the point where you’re bothered by the difference between year-ahead and five-year-ahead assumptions, it’s probably time to upgrade to a DCF model anyway.
PE: To use or not to use?
It’s virtually impossible to not use, or at least encounter, PE if you’re a reasonably active investor and reading investment media. PE is everywhere. It’s not very accurate, but I don’t think the solution is to banish it – rather, it’s something to be put in its proper place as a first-rung, back-of-the-envelope-type metric; one of several data points you might use to decide whether or not a stock is worth more detailed study.
This article is for informational purposes only and is neither investment advice nor a solicitation to buy or sell securities. All investment involves inherent risks, including the total loss of principal, and past performance is not a guarantee of future results. Always conduct thorough research or consult with a financial expert before making any investment decisions. Neither the author nor BBAE has a position in any investment mentioned.