News Roundup: 2024 Investing Learnings, Many Stocks Not Expensive, Small-caps to Power Back?
Surprising Learnings from 2024
If you’ve been reading the BBAE Blog for any length of time, you know that Charlie Bilello of Creative Planning has been one of my go-to sources for unique data points and charts. Charlie sent out a lengthy email about surprising lessons for 2024, and I’ll recap a few of my favorites here.
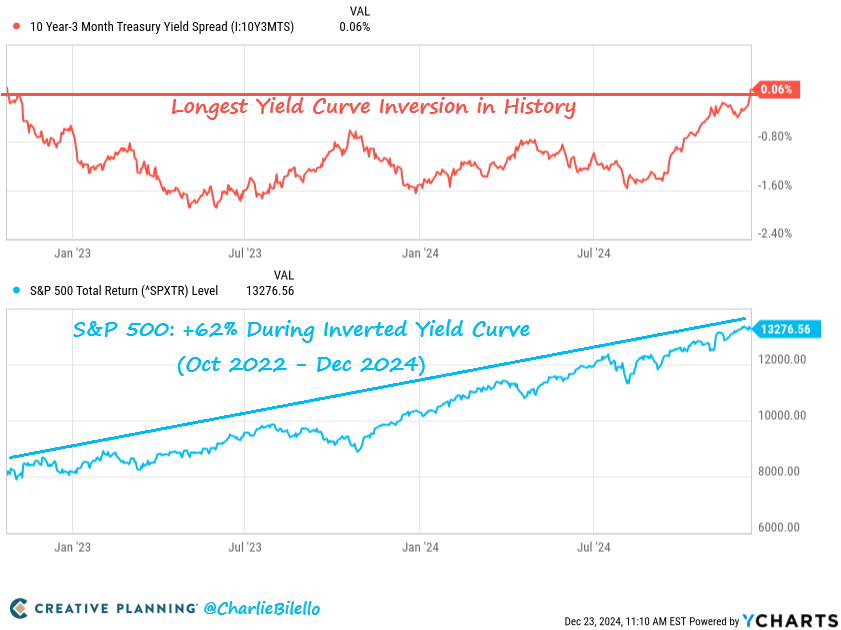
Charlie’s lesson #1: Inverted yield curve may have “always” indicated a coming recession before, but most recently it meant a great stock market.
This has gotten airtime (including from me) and deservedly so: The inverted yield curve foreshadowing recession was as close to a law of economic physics as it got. Data wonks pointed out that an inverted yield curve preceded every US recession since the 1950s.
So when the US yield curve inverted in 2022, the “recession” chorus started. But the recession never came. In fact, the stock market soared. Now, technically, some people have said that the recession is supposed to start not when the yield curve inverts, but actually when it begins to un-invert – i.e., around now. But even now, the US wouldn’t appear to be in (or even near) a recession.
This example is symbolically important to me because it’s a reminder that economics is a social science: We can measure it, describe it, and analyze it with numbers, but the underlying inputs are human decisions. Humans and humans, and don’t always follow “predictive” economic models, no matter how persuasive the math. Sometimes they do, and sometimes they don’t. That ambiguity may be frustrating, but as investors, we should paradoxically appreciate it, because it’s what creates the potential for profits.
Charlie’s lesson #2: The Fed’s dumping of its assets doesn’t mean asset prices will go down
This one’s more nuanced, but it’s another “rule” that wasn’t: The Fed bought a bunch of assets (to be fair, mostly bonds, whereas Charlie’s graph below shows equites) during Covid to shore up the economy – this buying caused asset prices to rise. “Everything bubble” was the going term.
It stands to reason, then, that the Fed’s unwinding of this should cause asset prices to go down. For scale, note the massive growth – from roughly $4 trillion to $9 trillion – in the Fed’s balance sheet from 2020 to 2022.
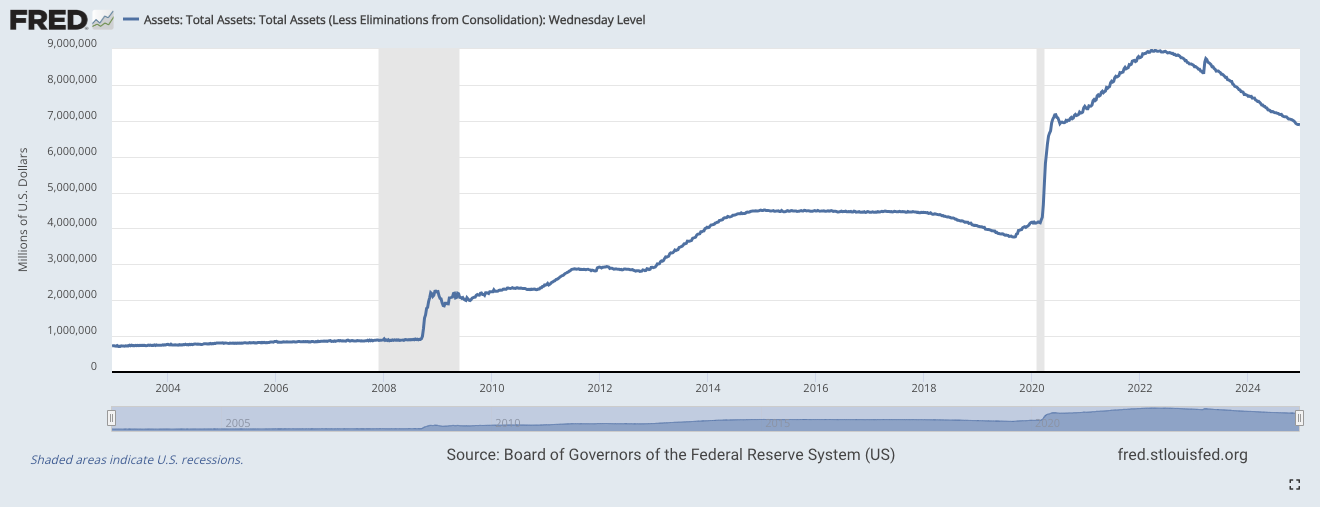
You can see the particulars of the Fed’s balance sheet here.
So the Fed added $5 trillion in assets. For comparison, the US has about $36 trillion in debt, takes in between $5 and $5.5 trillion a year in Federal tax receipts (and spends a bit more, which is called a deficit, and which is financed by borrowing, which adds to the debt), and the current US stock market capitalization is roughly $50 trillion. But again, it’s not like the Fed bought $5 trillion in equities.
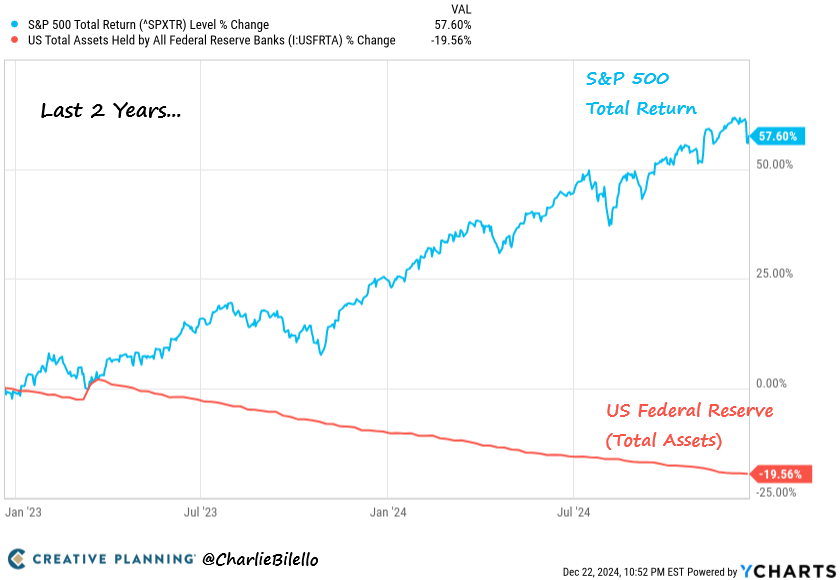
Maybe the market would have gone on an even bigger tear had the Fed not been unwinding, but I’m skeptical of that and lean toward Charlie’s interpretation: sometimes economic “rules” simply aren’t rules. Or, the nature of economics is such that virtually no economic rule works all the time.
Charlie’s lesson #3: Fed Funds rates do not map 1:1 to other interest rates
This is something I’ve talked about a few times here. As a generalization, investment media and those who consume investment media tend to overfocus on Fed Funds moves. As I talked about recently, the Fed Funds rate is an overnight rate between member banks of the Federal Reserve (all nationally chartered banks are members, and some state-chartered banks are); technically, it’s a rate between two private parties, but the Fed makes a suggestion that the member banks pretty much always follow the Fed’s “suggestion” to my knowledge.
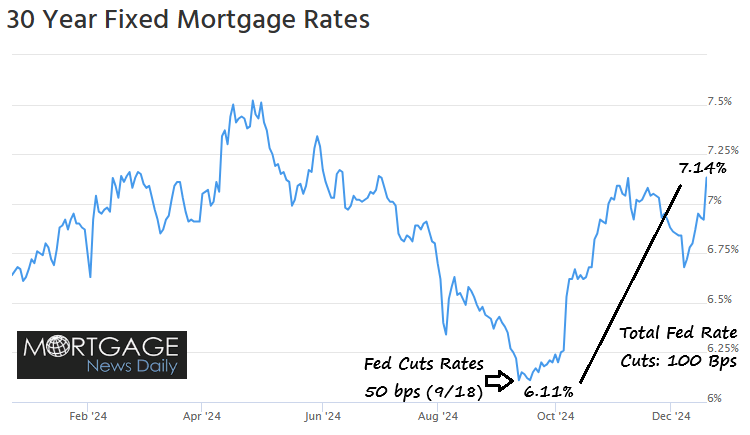
The Fed Funds rate maps pretty well to 1-year Treasury rates. But less directly to others. Case in point: US mortgage rates rose after the Fed cut Federal Funds rates by half a percentage point in the fall of 2024.
US stocks still aren’t cheap
Yes, the US market is expensive in aggregate. Have a look at the Shiller P/E ratio.
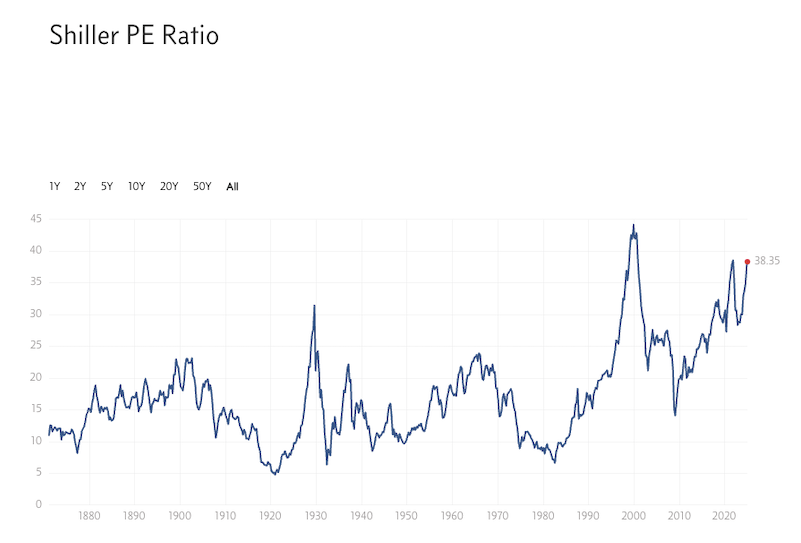
There’s an argument that P/E is misleading these days, because today’s S&P 500 firms lean techy and intangible: They are more profitable, far less asset-heavy, and arguably have more optionality and more potential upside. In other words, saying that just because the mean or median Shiller P/E is 16 or 17 doesn’t mean that today’s number of 38 is automatically overpriced.
Well, 38 is more than double the norm, so today’s market is probably overpriced. I’m not sure that S&P 500 firms are twice historical quality, but quality may explain some of the discrepancy.
Ryan from MarketLab has another angle on this: It’s not all US stocks that are overvalued. He looks at forward P/E and finds that 45% of S&P 500 companies are cheaper than their historical average. Pretending this is a fair metric for valuation, we’d have just a slight-to-modest majority of US stocks at above-average valuations.
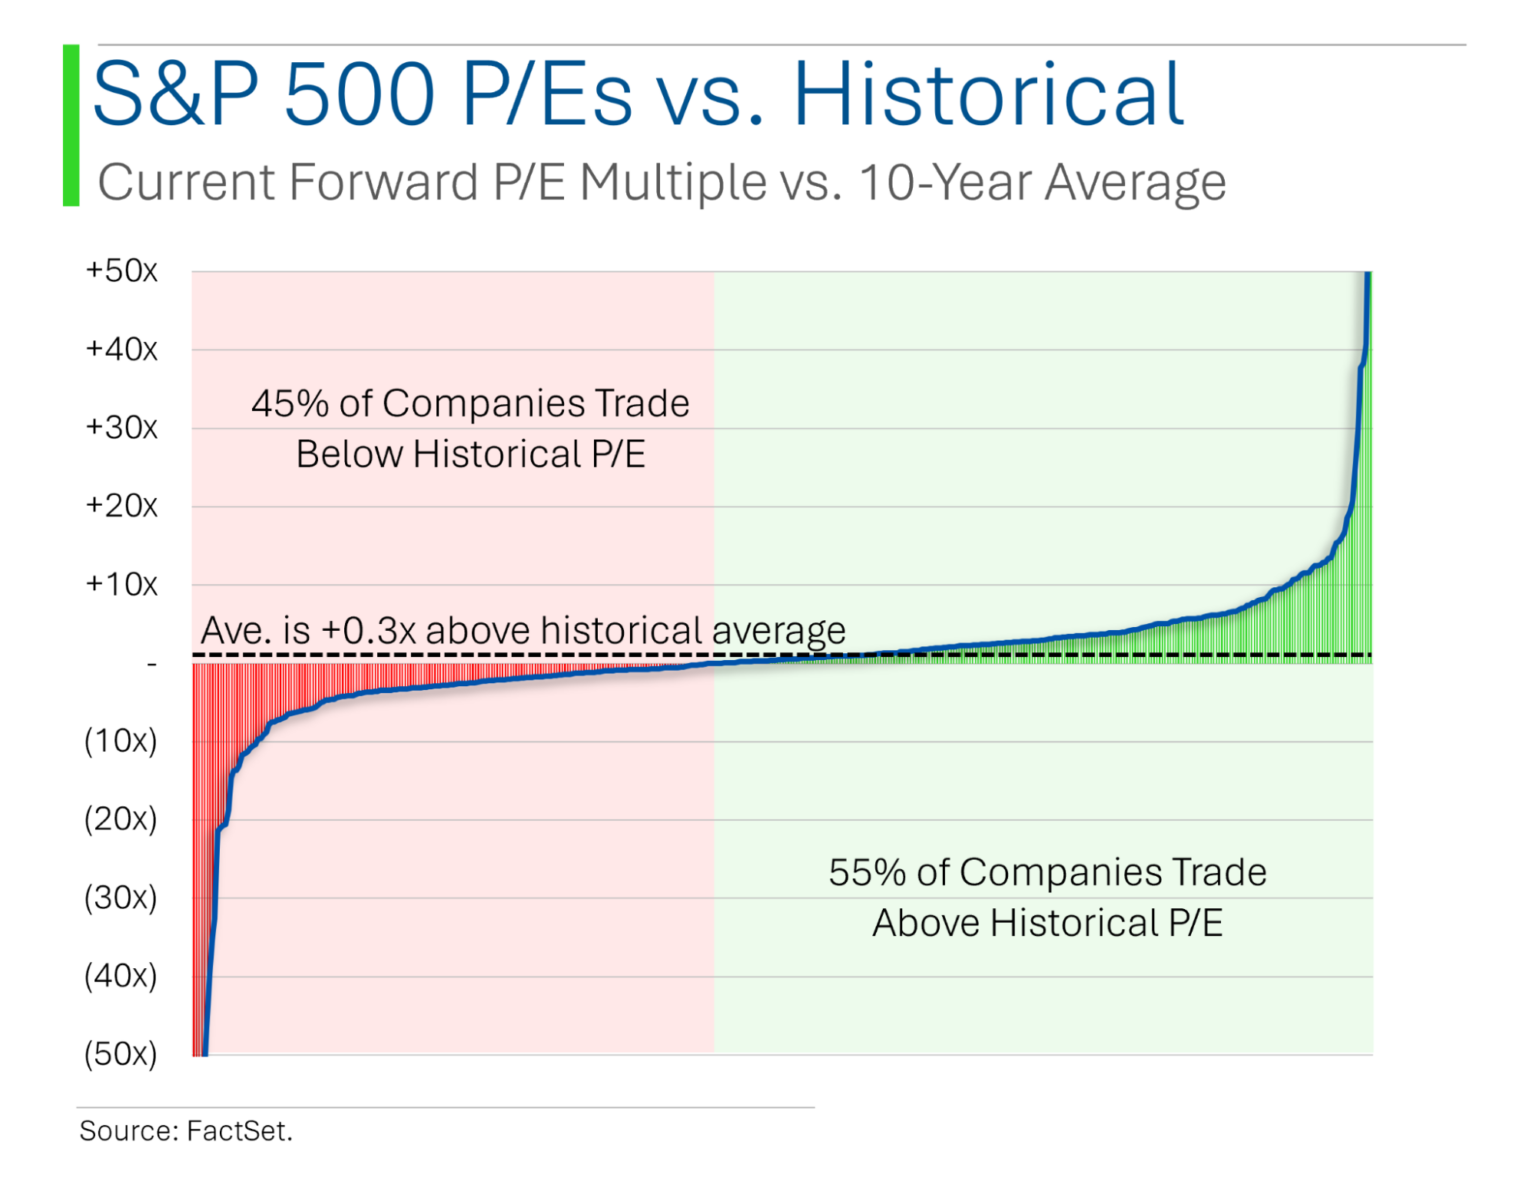
What I’m curious about is the area under the curve on the far right. This graph doesn’t appear to be cap-weighted; I’m pretty sure that tails are always going to be extreme on a chart like this, but I’d guess that these days, a small number of very pricey stocks are pushing the market into “overvalued” territory, with many everyman-type stocks trading at fairly reasonable prices. This is good news for investors.
Small business owners rejoice
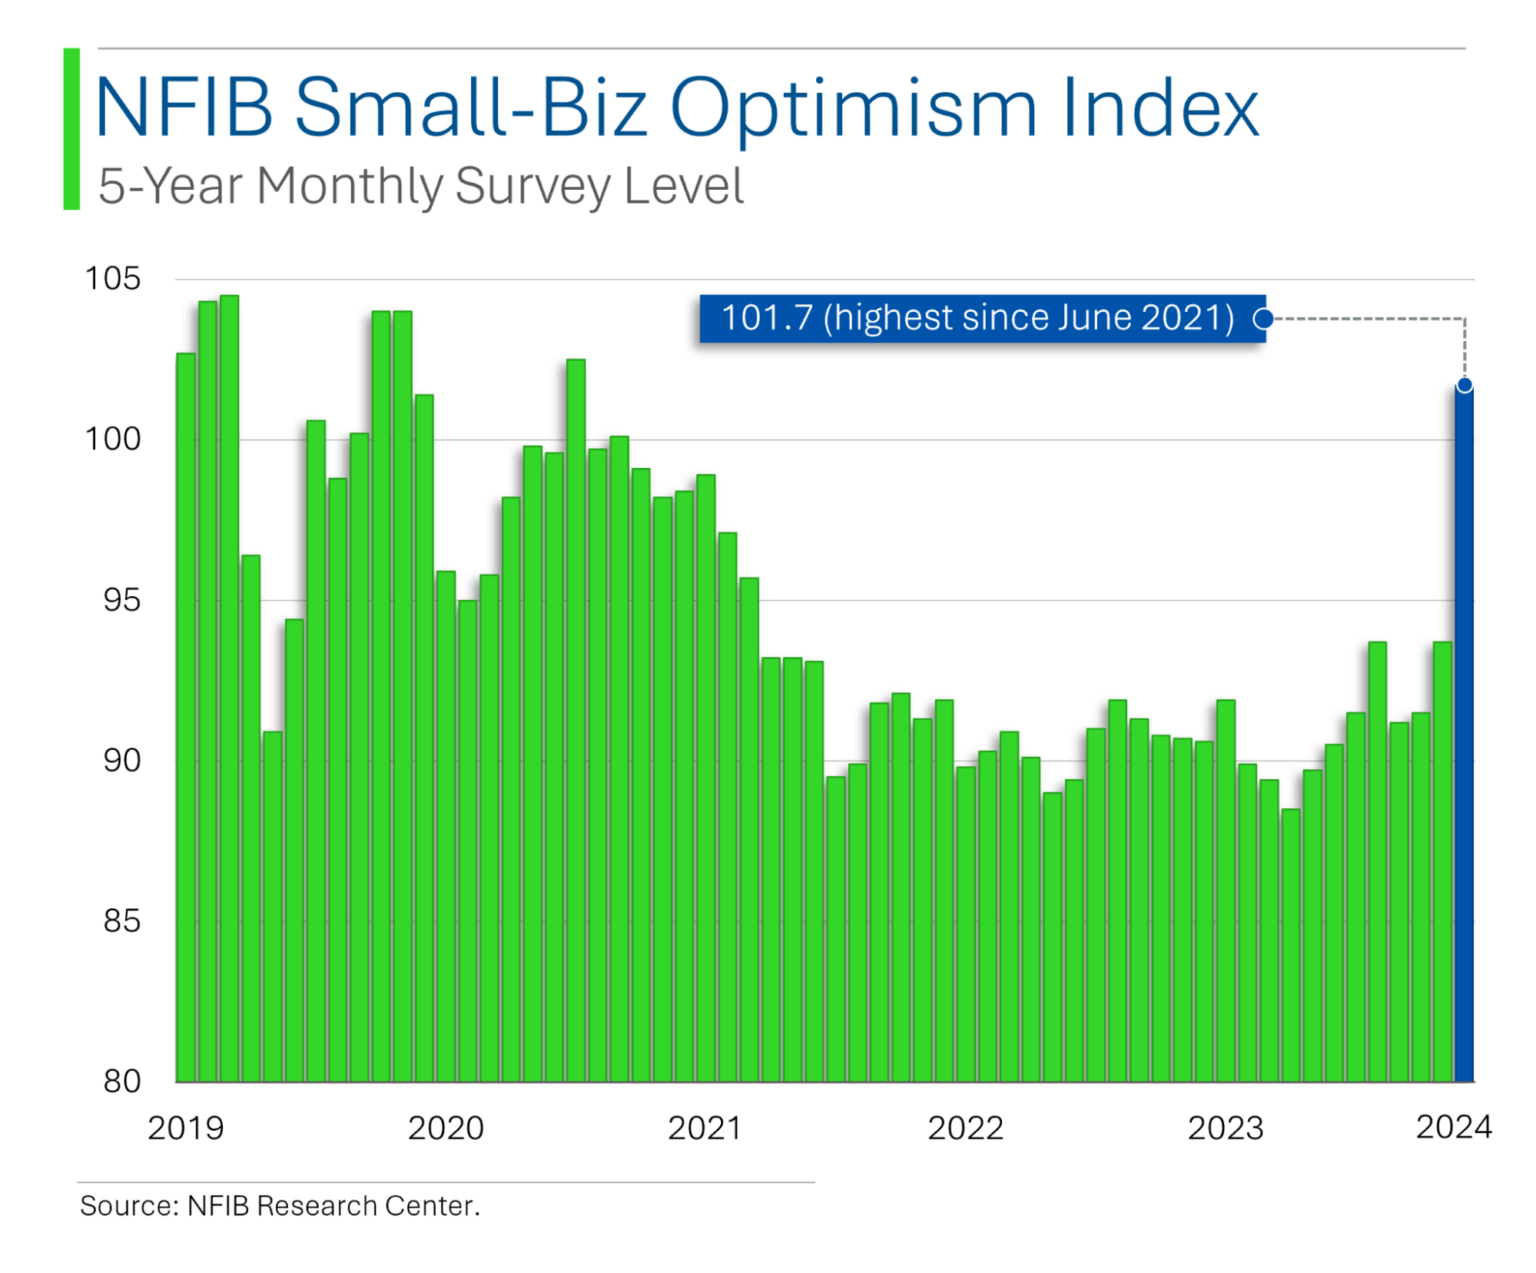
Speaking of Ryan, he’s also got a graphic showing how optimistic small businesses are after Trump’s win. They likely believe his “America first” agenda will favor US companies. And while the NFIB survey is done across NFIB members (basically, small private companies), this America-first logic likely extends into small caps, too. I’m tepid on emerging market stocks until I see evidence that the US dollar is set to decline, but I’d be easier to persuade that US small caps could outperform large caps over the next 3-5 years.
This article is for informational purposes only and is neither investment advice nor a solicitation to buy or sell securities. All investment involves inherent risks, including the total loss of principal, and past performance is not a guarantee of future results. Always conduct thorough research or consult with a financial expert before making any investment decisions. Neither James nor BBAE has a position in any investment mentioned.


