

News Roundup: Stocks in Election Years, Cash on Sidelines Gone, CME’s ROIC
Calm Stock Market in Election Years
The mysterious “Ryan” who writes StreetSmarts by MarketLab does a great job with graphs.
This fact may not impress the younger set, but as a Gen Xer who once spent several days working pixel-by-pixel to create a fake ID in the early days of Microsoft Paint (an ID that ended up getting used exactly zero times), I’m impressed.
And as this is an election year, Ryan has compiled two charts showing what in retrospect feels intuitive, but which is nice to see in the numbers: The stock market has tended to mellow out in election years, with an election year return of 5.8% and a non-election year return of 11.8%.
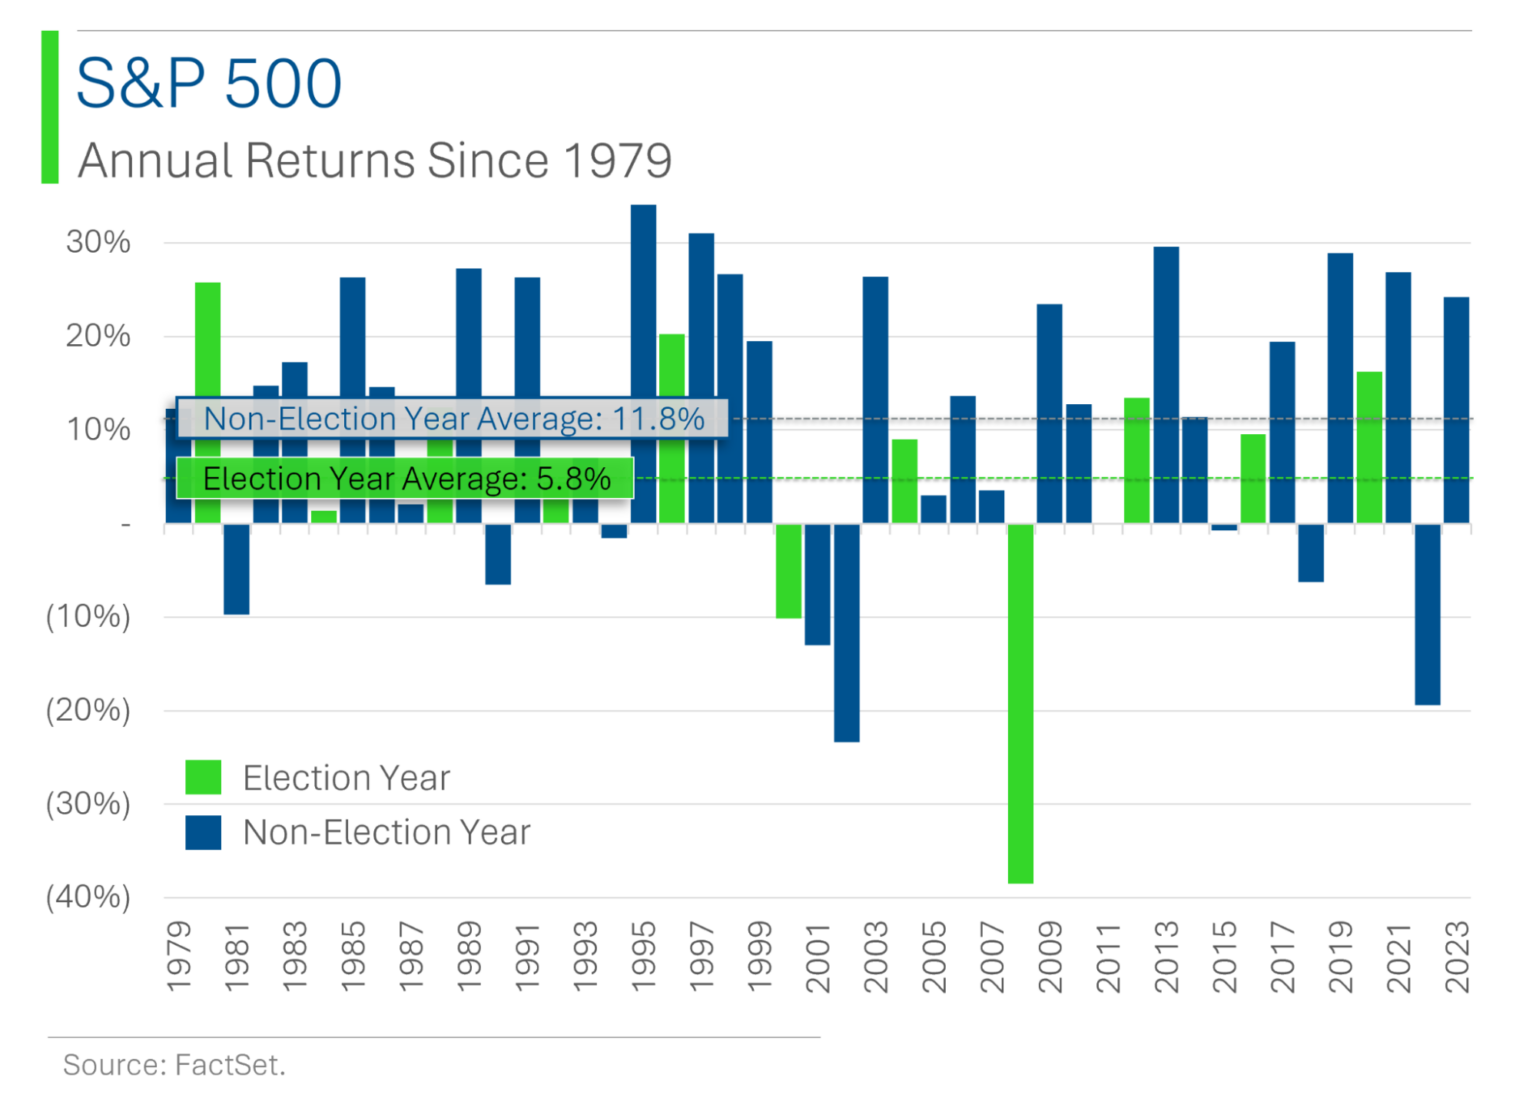
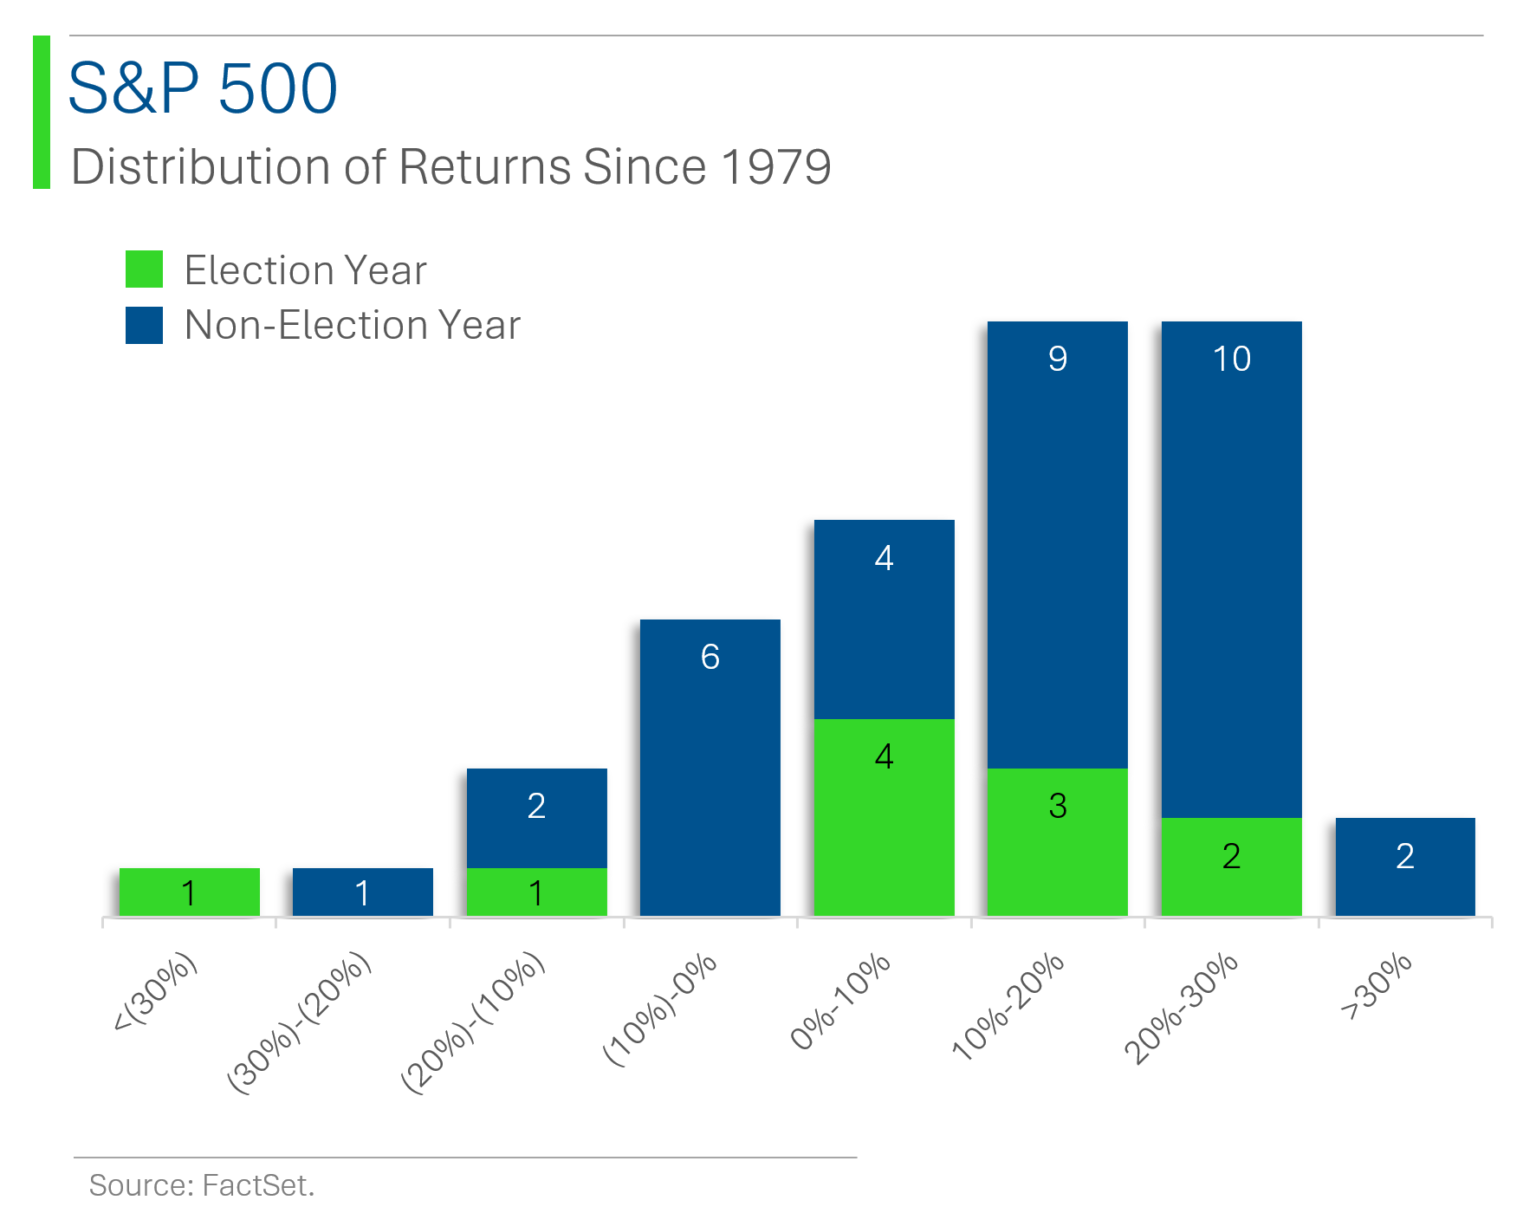
Moreover, election year returns appear more tightly clustered around their average. The boat rocks a bit less if there’s an election, and blowout years have been less likely.
One caution is that these interpretations are from historical trends, and what happened in the past doesn’t necessarily happen in the future.
Many factors affect stocks.
It makes sense that an incumbent president seeking reelection may, knowing that incumbents have had an advantage (although apparently the “incumbent advantage” is now debatable), may want to keep things steady-to-slightly-positive as the election nears. That might mean fewer big, politically risky proposals get proposed, for example. Plus, the incumbent’s mental energy is likely focused on winning the next election.
I’m skeptical of going too far with this, though. The US is not a dictatorship. And human cognitive bias tempts us to read too much into historical patterns that aren’t really as predictive as we’d hope.
That said, everyone likes to see these patterns, myself included. US Bank did a comprehensive study on election years and stock markets and produced the following chart which, if I’m honest, slightly underperforms Mystery Ryan’s in the aesthetics department.
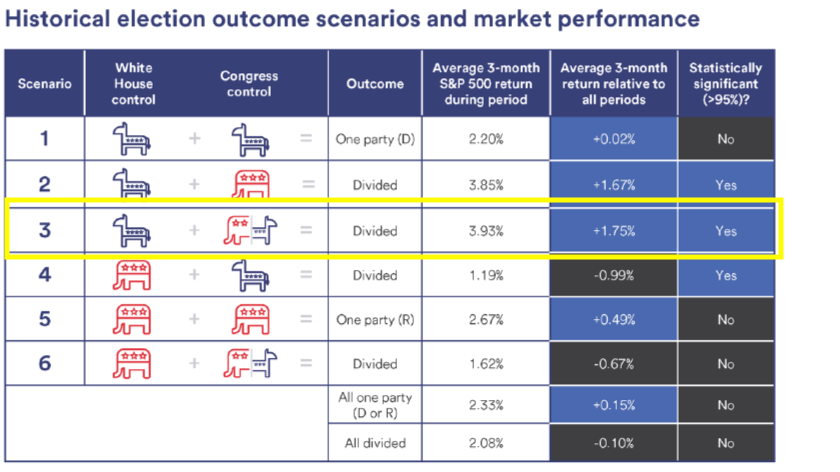
The US Bank graph descriptions are somewhat terse, but basically what their analysts are doing is looking at the returns in the three months after the election relative to the general/average return of any three-month period, and seeing the difference.
The long-term investor in me cringes when I see “three month” – I simply don’t care much about short-term results in the stock market – but I’m guessing the analysts would say measuring the time period right after the election gives the “purest” measure of the election impact, whereas if you looked at the year following the election, more market-moving variables would sneak in. Just a guess.
Divided government = better for stocks
Anyway, the key point is that divided US governments have been measurably better for the stock market than governments in which one party controlled both the White House and Congress. In fact, the best results came from having a Democrat as President and a divided Congress.
First Trust put together a nice infographic on elections by party as well. Note that their results look at election years only, and not performance during full terms. So this data cannot be used to say one party has been better or worse overall for the stock market (other data can, and FYI, the market has gone up 14.3% per year under Democratic Presidents, versus 9.3% under Republicans).
Anyway, here’s a look at what First Trust found during election years:

But back to my earlier point: This election stuff is just one variable.
To quote US Bank’s own election report: “The historical data suggests that economic and inflation trends, more so than election outcomes, tend to have a stronger, more consistent relationship with market returns.”
Yes, yes, and yes.
And, if you read my last BBAE Blog piece on momentum in the stock market (hint: higher than it’s ever been), you know that the market has been on fire for what are presumably non-election reasons.
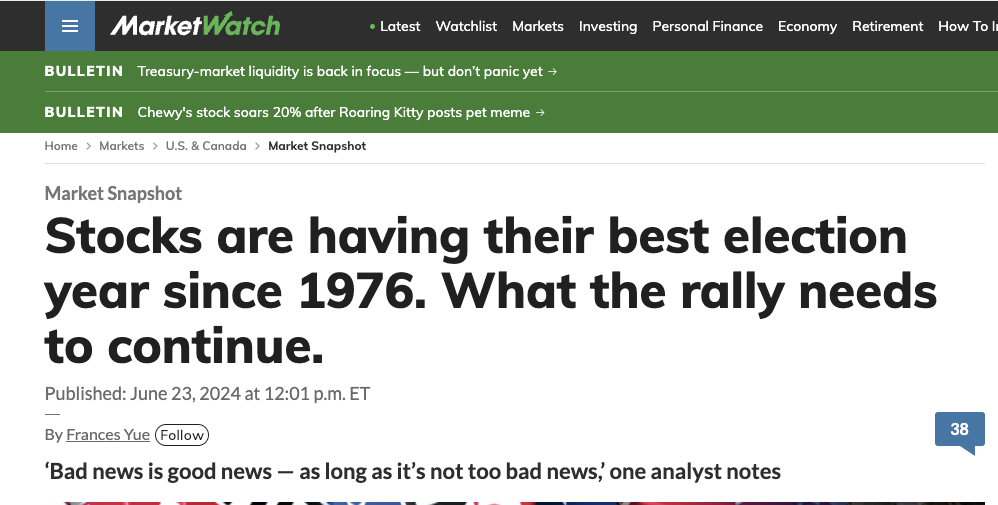
So we’re not having the calm, muted, average election year, as Frances Yue mentions in MarketWatch.
“Cash on the Sidelines:” No Longer on the Sidelines
One of the near-memes of the past five years – or past 10 years, or 15 years, depending on how long your memory is – is that cash has been building up on the “sidelines” of the capital markets (i.e., in money market funds, CDs, bank accounts, etc.), ready, like a coiled spring, to be deployed in markets sooner or later, thus boosting equity (or bond/option/commodity/future) prices.
This Visual Capitalist infographic exemplifies:
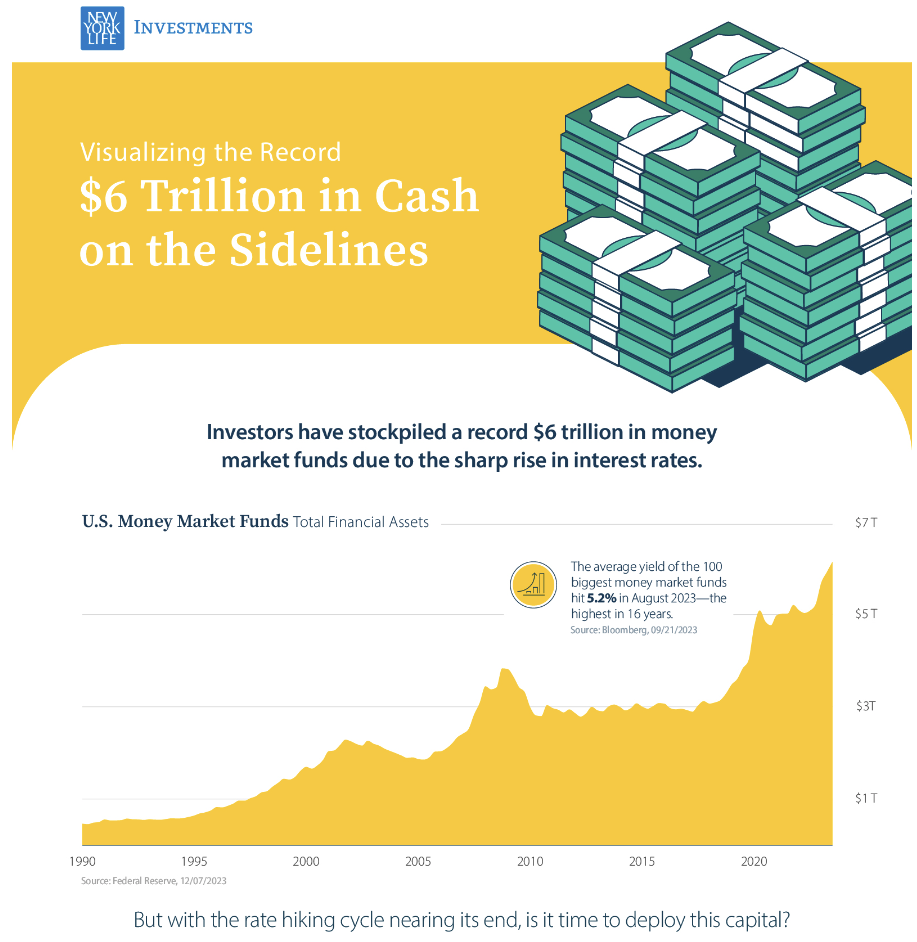
This theory has a promising, optimistic ring to it. But it is running aground for two reasons.
The first is that “excess” savings – which the San Francisco Federal Reserve defines as the amount of savings in excess of pre-pandemic levels – no longer exist.
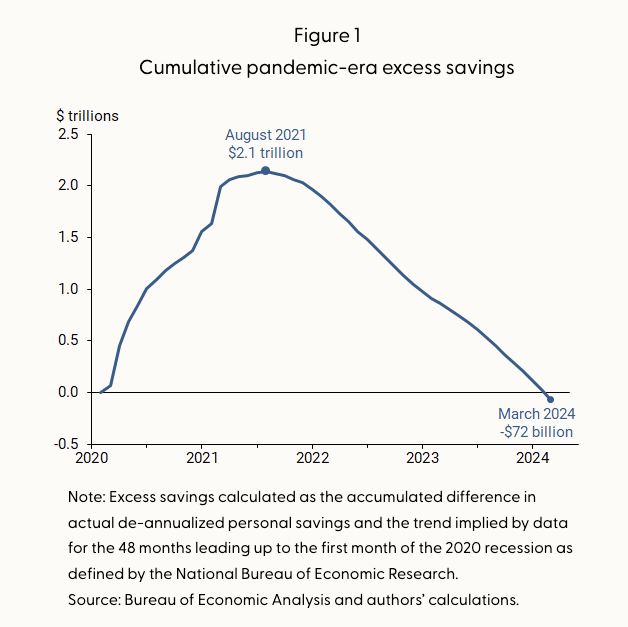
Sam Ro from Tker.co recently shared a similar chart from Bloomberg with two more months of data. The trend is continuing. The COVID cash has come and gone.
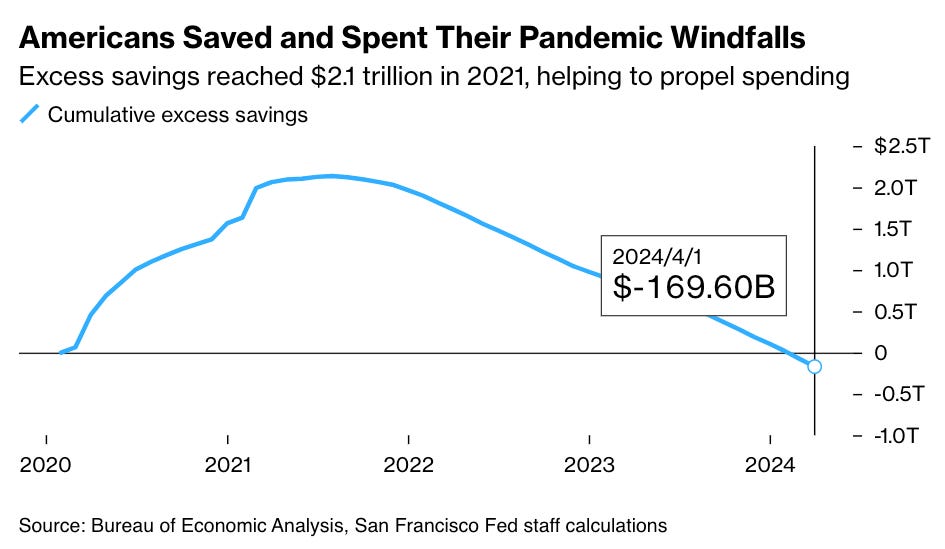
Now, excess savings is not the same as cash on the sidelines. The latter is a broader measure.
It’s notable that spending is up and savings are down. In an article about this, LPL Financial says it’s not a terrible worry because refinancing at low COVID-era rates lessened homeowners’ financial burdens, making them healthier.
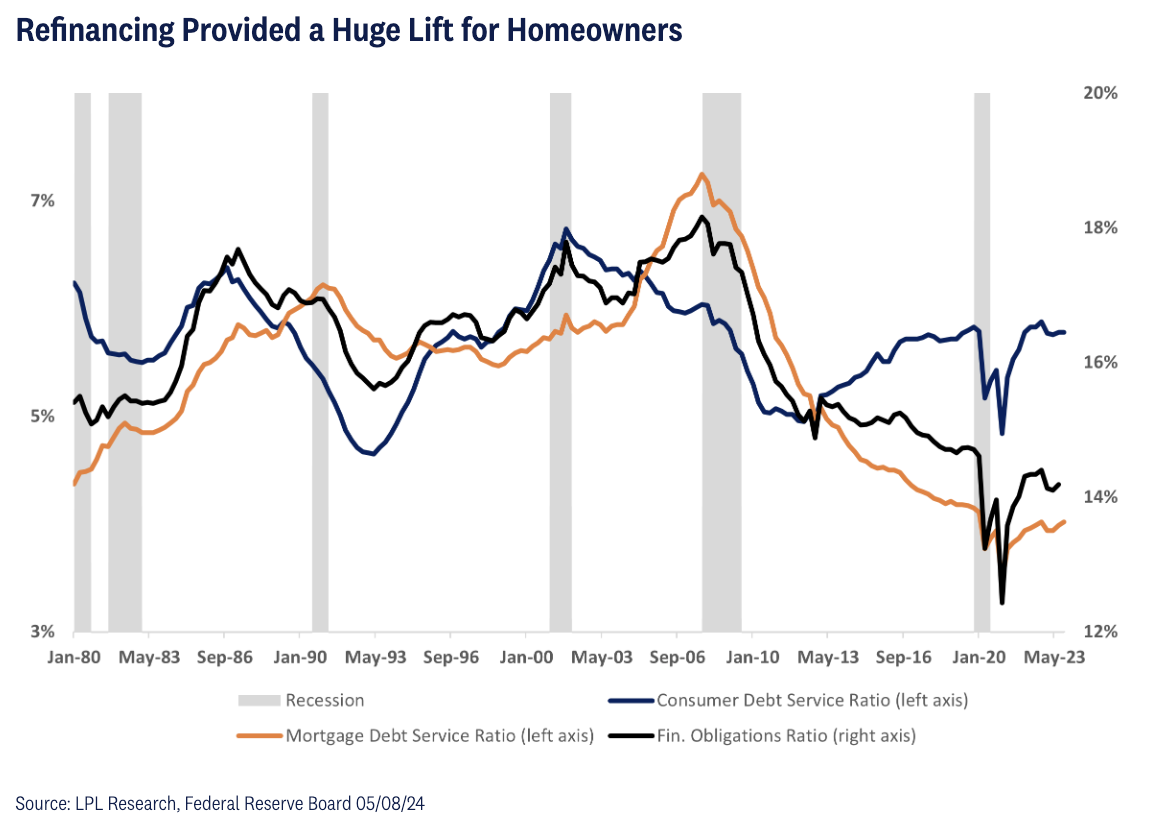
If you’re not a homeowner, then you don’t have this benefit, though.
Sam echoes a point made by a Goldman Sachs analyst that “excess savings” are an overhyped focal point in that they’re generally a modest portion of households’ net worth.
And an article by Fisher Investments makes a convincing claim that much of the increased money we’re measuring in cash management instruments was never and will never be earmarked for stocks: it was plunked into money market funds by fearful depositors moving cash from smaller banks following the SVB and Signature Bank blowups, or it’s businesses getting a better cash management return, or emergency savings.
I mostly buy this. (Side note: I think the point made with the rest of the article is largely incorrect (I contend that more buying does drive up prices) and that Fisher’s Editorial Board misunderstands dilution: A secondary offering may bring in more shareholders and thus dilute existing shareholders’ percentage ownership in the company, but it does not in principle dilute the value of their holdings because those new shares are sold at their fair cash value, and that’s the only economic dilution.)
Takeaway: No big cash windfall coming to “save” markets (that don’t need saving)
The quotes are because it’s obvious that markets at or near all-time highs don’t need saving. If anything, I see the market’s record-high momentum as a risk in that these highs are “houses” based on whimsical foundations. I’d prefer for momentum to cool off and fundamentals to take a stronger role in investors’ decisions, because that will result in a more sustainably healthy market.
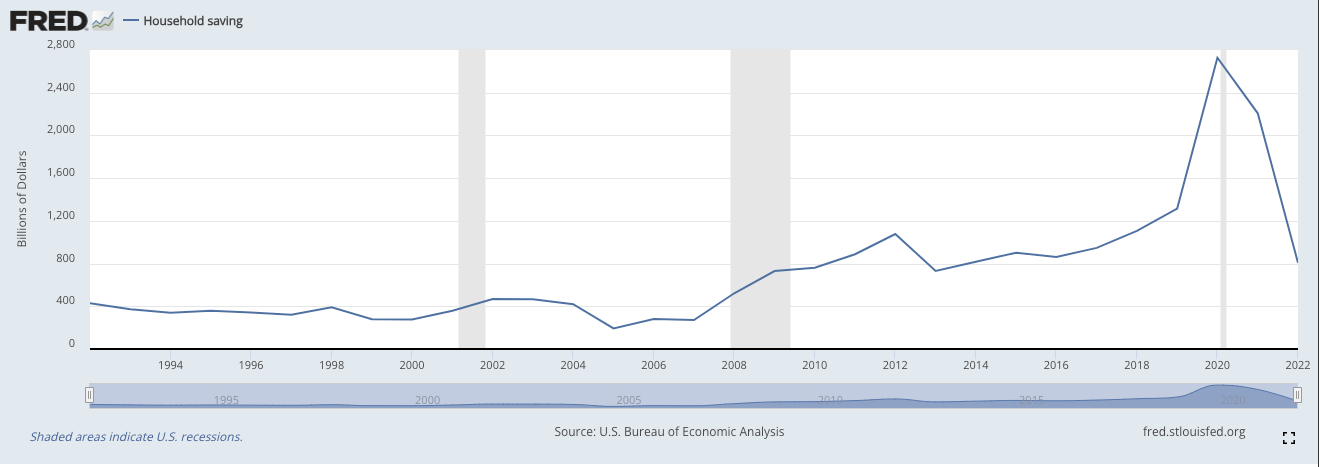
It’s fine if cash on the sidelines stays on the sidelines. More important to me will be signs of a deterioration in the financial health of individual Americans or American households. A chart showing household saving is not yet worrisome on an absolute level, but if the trend continues, it could start to become so.
CME ROIC analysis by John Rotini
Rather than talking about a great company or stock, I’m going to talk about a great bit of analysis on a stock that I saw.
Let’s back up: If you read the BBAE Blog often, you know that I talk a lot about big-picture things, like economics. I enjoy writing about topics that affect many people. In fact – flex alert – I had a guest column for two years in the Hong Kong Economic Journal magazine (at the time the most respected mass-market economics publication in Asia) to dish on macro.
But it may surprise you that most of my investing career has centered around deep fundamental analysis of companies. When I was Director of Research & Analysis for The Motley Fool, I had the privilege of teaching equity valuation to the incoming analysts, basically over a decade. One of the most promising was John Rotini.
I haven’t talked with John since Fool but was delighted to see that he published a guest piece on the CME Group (owner of the Chicago Mercantile Exchange, and a few others) on the New Constructs website.
John talked about return on invested capital (ROIC). ROIC is my favorite metric, yet it’s seldom talked about because it’s too complicated for most casual investors.
John’s gist was that while CME’s ROIC prima facie looks unimpressive, it’s better than it appears for two reasons.
First is that it’s trending up:
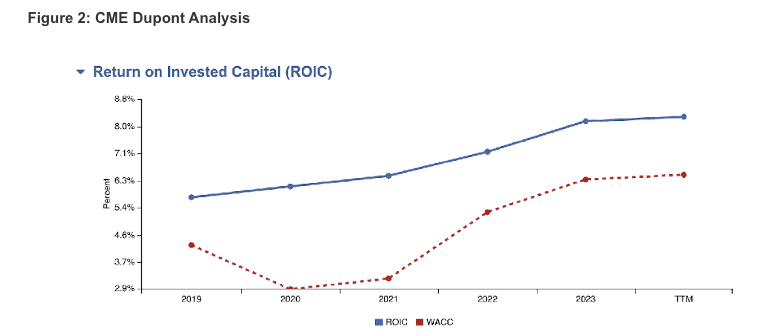
Second, this “default” measure of ROIC embeds intangible assets (presumably goodwill) from some long-ago acquisitions. It’s debatable, though, whether or not these should rightfully be considered “invested capital” on which a return is supposed to be earned.
I mean, yes, they are, in an all-in sense. CME did the acquisitions. It’s a big boy and is responsible for them and their accounting results.
But accounting for intangibles has always been weird – the nut has yet to be optimally cracked by either the FASB or IASB (FASB sets US GAAP accounting standards and IASB sets the more international IFRS standards) — CME is not in the habitual business of acquiring stuff. In fact, they gush cash, with a 5-year free cash flow margin of 58%.
That’s nosebleed-level profitability. As John says, it’s one of the best businesses on earth by that metric.
And John found that if intangibles are removed – if ROIC morphs to ROTIC, or return on tangible invested capital – CME suddenly looks much better by what’s arguably the most important business metric for investors.
John isn’t recommending CME’s stock, and neither am I. And to be fair, a small subset of hardball professional investors (those into deep financial statement analysis) may undertake this kind of study, but it’s rarely talked about in the public investment community.
Kudos to John for doing fresh, real analysis.
This article is for informational purposes only and is neither investment advice nor a solicitation to buy or sell securities. All investment involves inherent risks, including the total loss of principal, and past performance is not a guarantee of future results. Always conduct thorough research or consult with a financial expert before making any investment decisions. Neither the author nor BBAE has a position in any investment mentioned.