Weekly Roundup: Not-So-Overpriced Stocks, Emerging Markets, ETFs Killing Mutual Funds?
US Market has earned at least some of its rich valuation
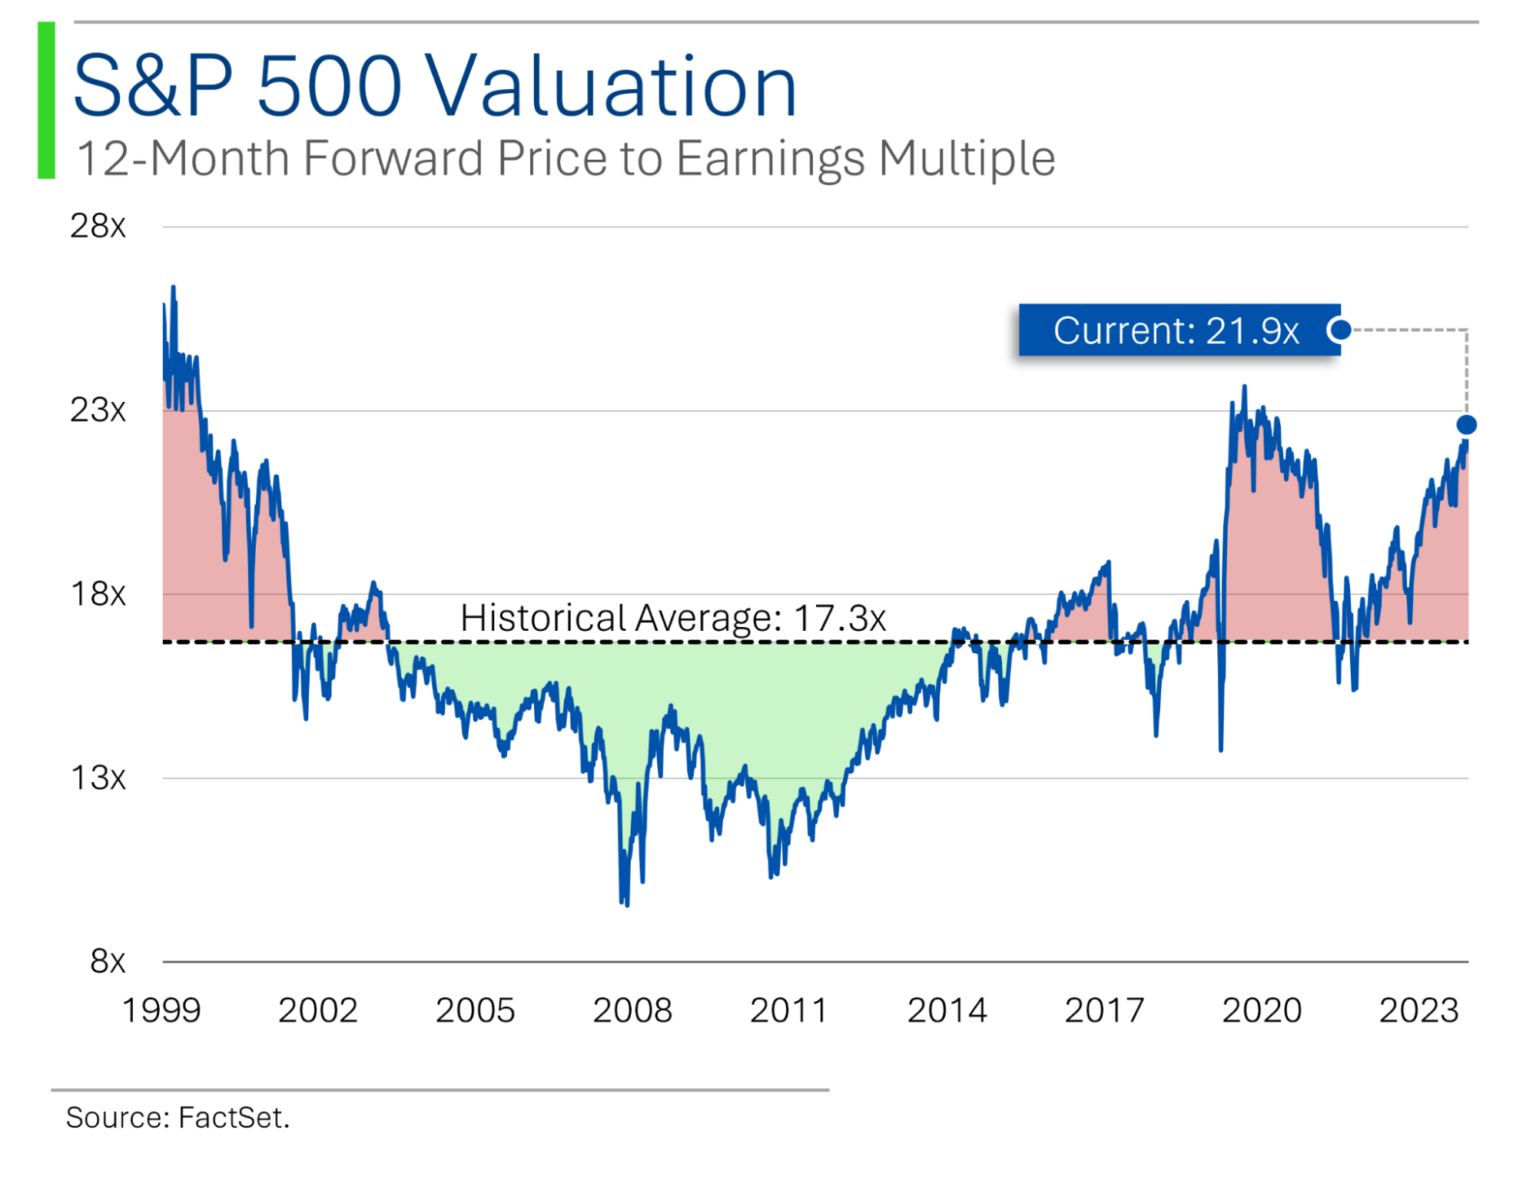
Much to do has been made, including on these virtual pages, about the high valuation of the US market, as this graphic from our trusty (and now weekends-only) Canadian friend, Ryan from MarketLab, who can almost surely make a graph before I can find the backslash key on the keyboard.
It’s an easy visual: For roughly the past 25 years, the S&P 500’s forward P/E has averaged 17.3, and now it’s 21.9:
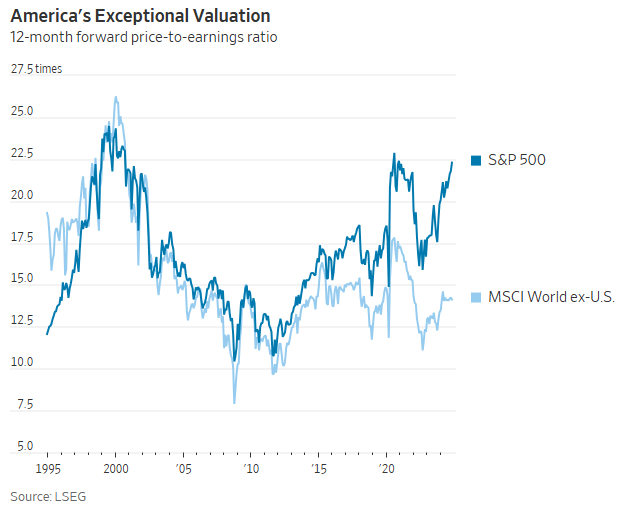
While we’re at it, the S&P 500’s forward PE ratio is not just high relative to its own history; it’s high relative to nearly everywhere else:
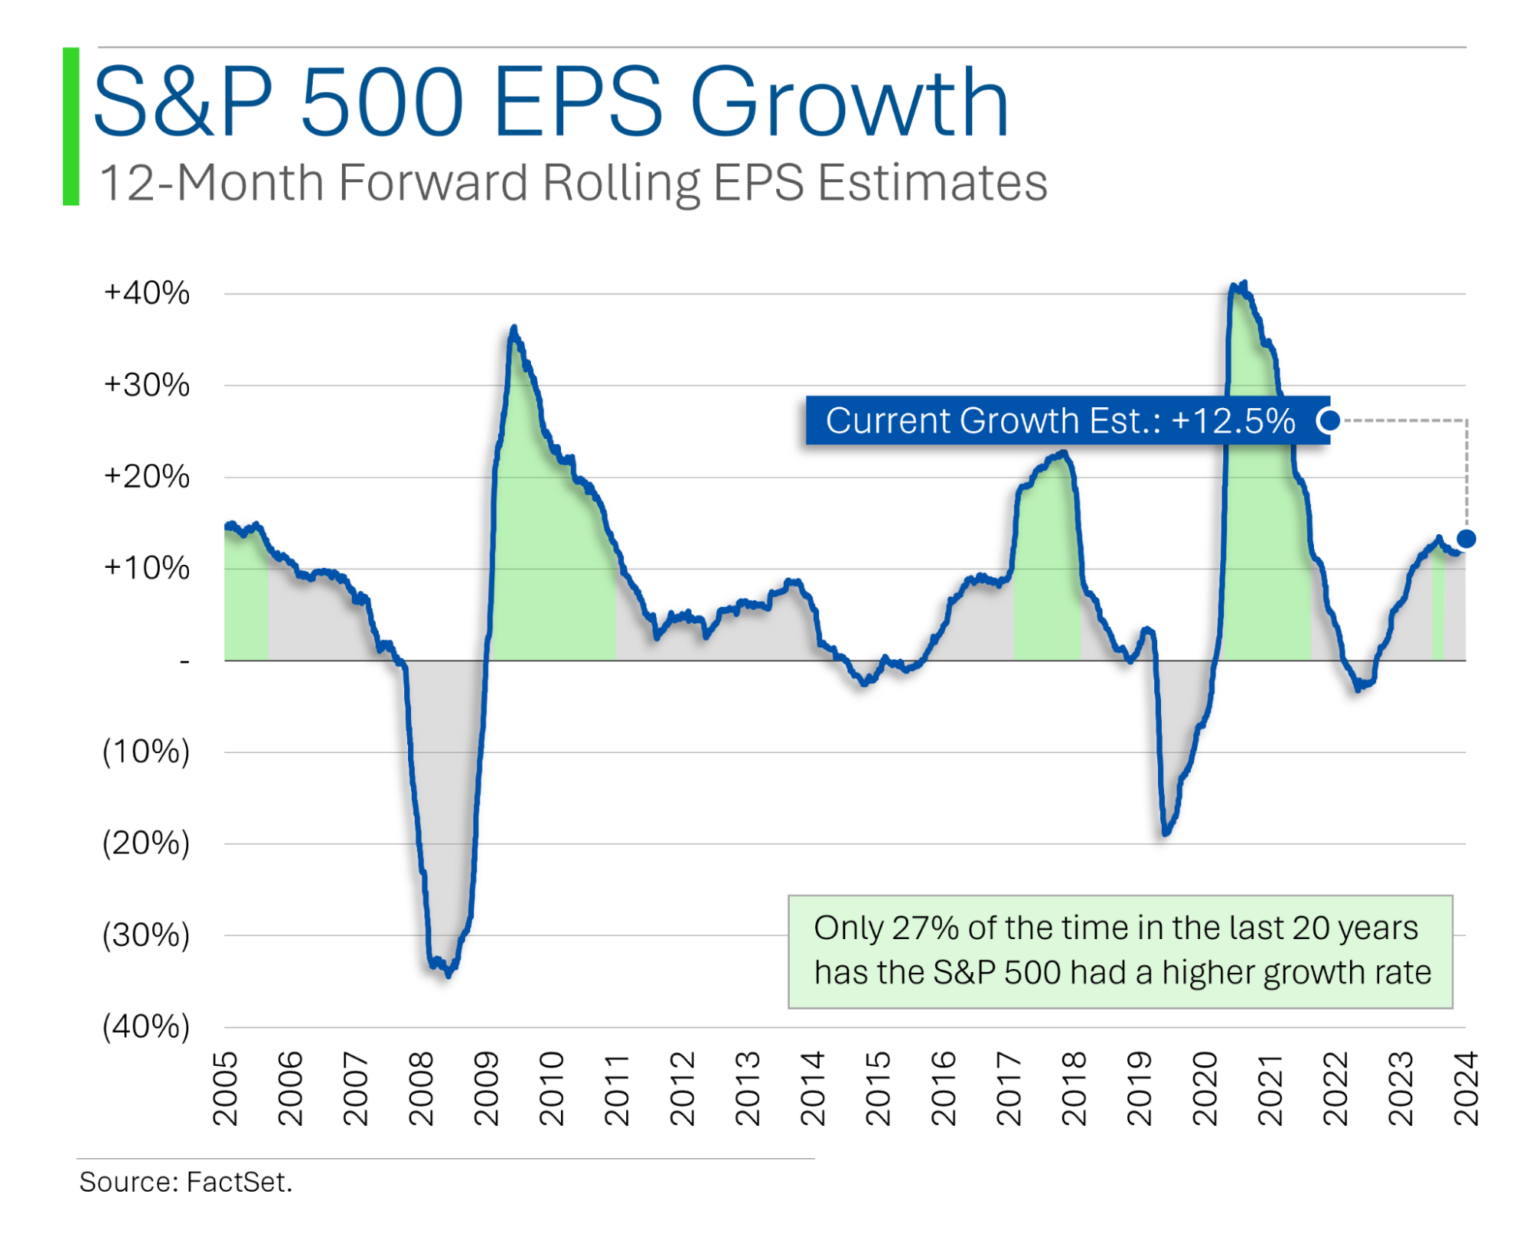
The good news: Earnings growth has been rising, too. (I think the ~40% post-COVID growth number is “better” than it looks because earnings were growing from such a depressed number.) This doesn’t mean the market can’t be overvalued, but just that earnings and P/E go together, so it’s perhaps less overvalued than it seems.
Emerging markets: What a difference a chart makes
I don’t mean to pull a Ryan doubleheader – well, I guess I do, because he’s got two interesting points this week.
The second regards emerging markets. I did a piece on emerging markets a while ago; the simplest takeaway is that the weaker the US dollar, the stronger emerging markets, and vice versa (one reason is that EMs often hold a lot of dollar-denominated debt, which becomes “expensive” for them to service when the dollar appreciates relative to their local currencies).
The point I want to make now is that if someone just showed you Ryan’s first graph, you’d think that emerging markets are absolutely the way to go: Emerging markets have crushed US stocks since 1992. European stocks, well…
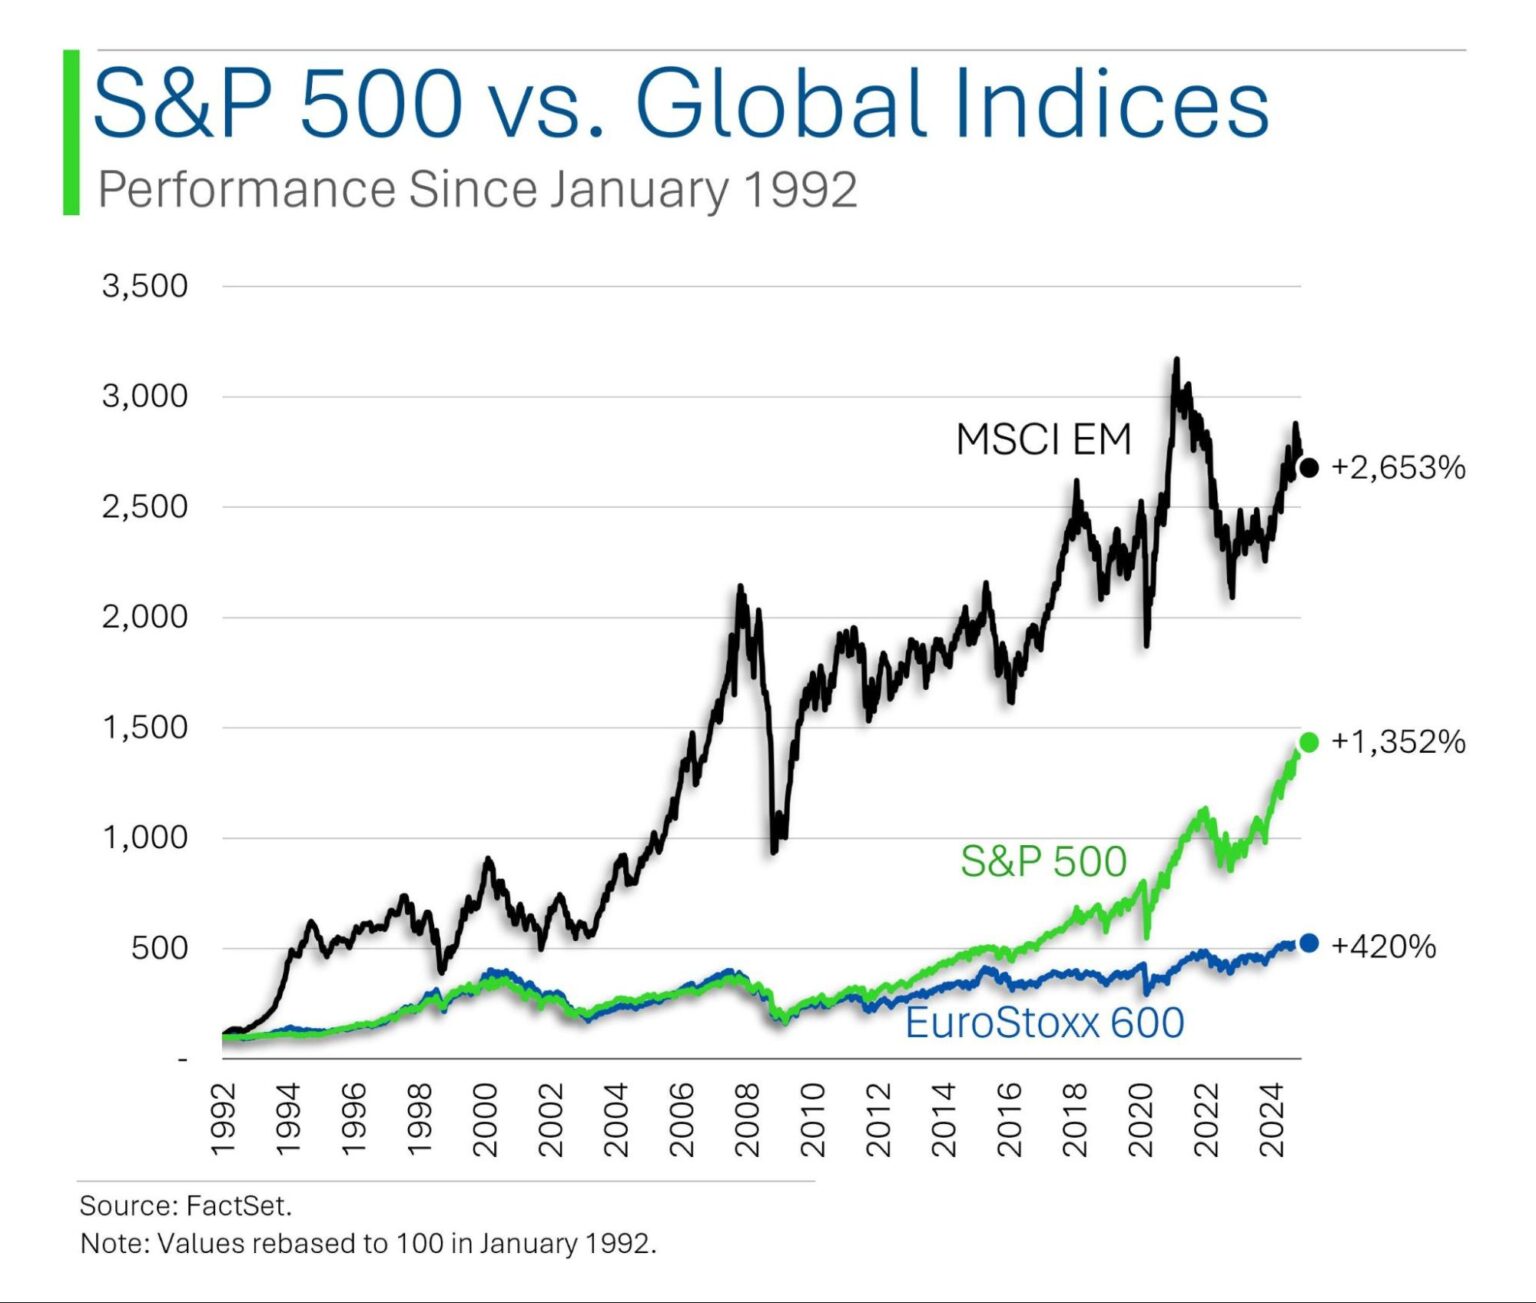
Hold your horses, though: Charts can be misleading. Starting from the nadir of the Global Financial Crisis of 2008 (despite the name, the nadir actually came in early 2009), the US stock market clobbered emerging markets.
Ryan did not choose this date by accident: The US dollar soared from this date, so it’s not surprising to see emerging markets lag. Incidentally, there were spades of dollar naysayers at the time who were absolutely convinced that the dollar would plunge thanks to all the money printing. What they missed was that practically everybody was doing money printing. The US economy may have been a drunk driver, but it was the least drunk driver on the road: global chaos causes a flight to quality – i.e., away from emerging markets and to the US.
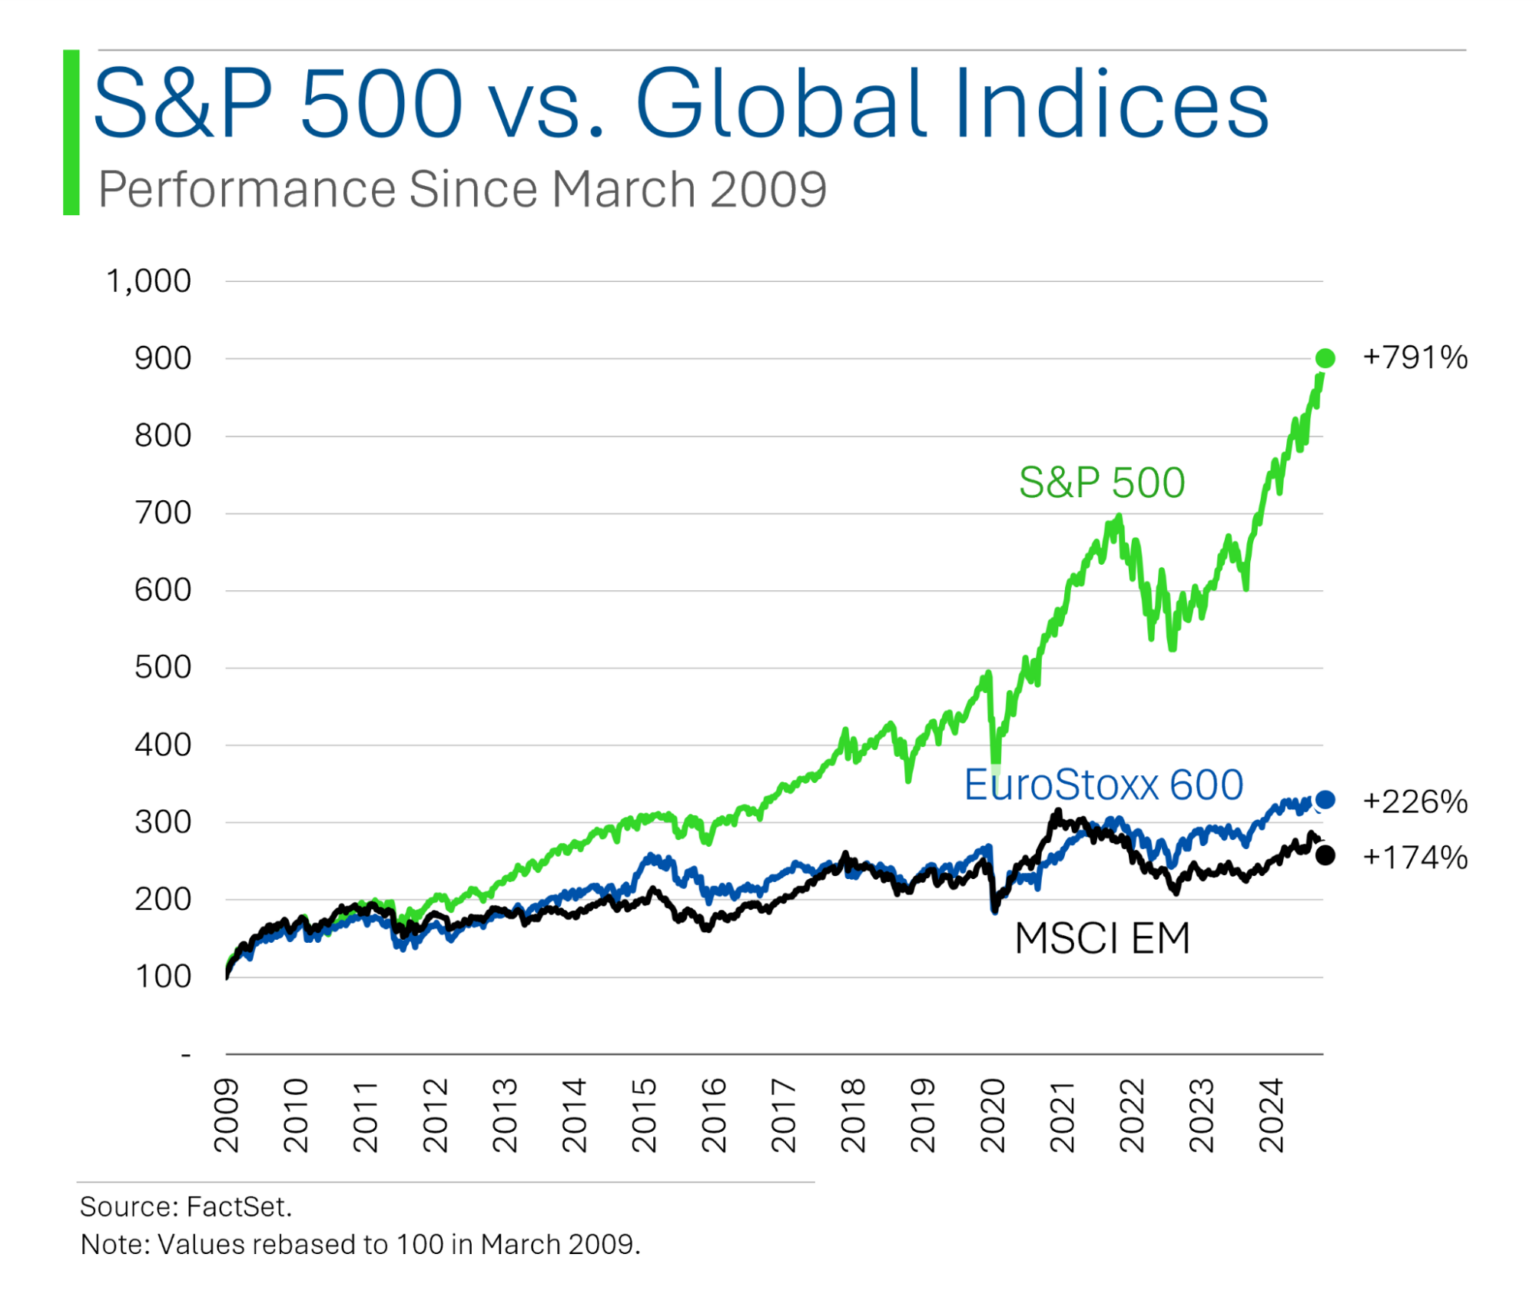
The takeaway for investors? Besides the mechanics of EMs – you may not want to invest in them unless you’ve got a clear and present thesis for a dollar decline – it’s often possible to tell completely different and often opposing narratives based on what time period you choose on a chart.
By the way, for visual evidence of the dollar-EM relationship, here’s a graphic from Charlie Bilello.
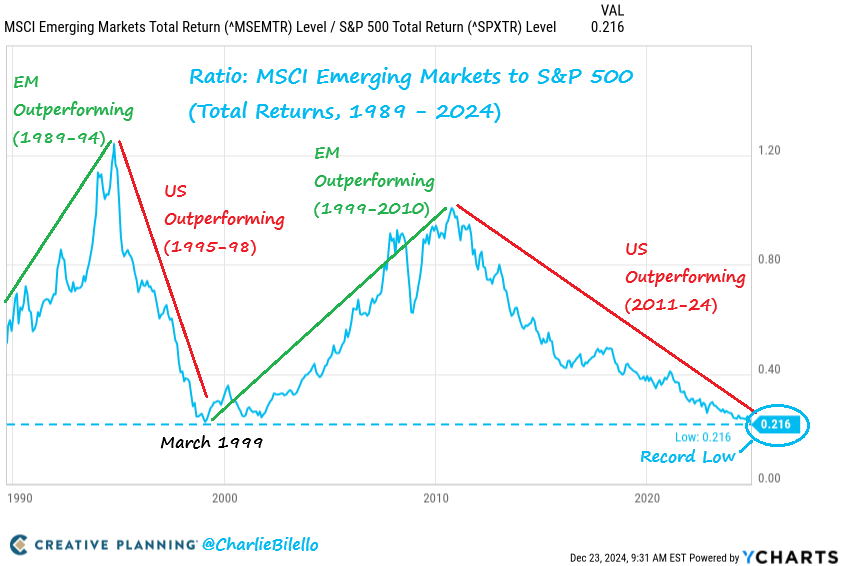
Source: Charlie Bilello / Creative Planning
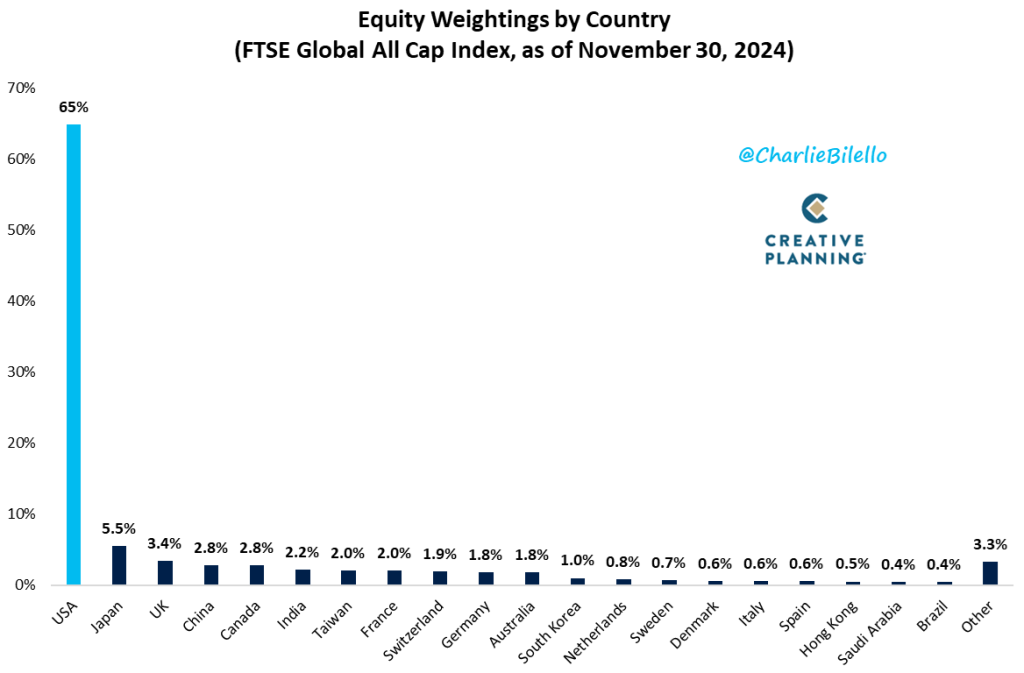
The proportion of the US’ market cap relative to the rest of the world was going down – which makes logical sense because the rest of the world is, broadly speaking, catching up economically, but in recent years has started to go back up (it was ⅔ as of last count). The US has become the Ivy League for global businesses and capital. You can see how it dominates the FTSE Global All Cap Index.
ETFs don’t have to sell
Although ETFs are, according to the Investment Company Act of 1940, mutual funds in a legal sense (more technically, they are taboo under the “ ‘40 Act” and needed to individually file for exemptive relief until 2019) , one of their real-life perks is that they are not mutual funds – besides being exchange-tradeable (less of a selling point for me), they’re tax efficient because they can swap shares for things called creation units with preselected counterparties (self-clearing brokers called Authorized Participants, or APs) who’ve agreed to participate in such swaps. There were 37 active APs in 2023, so it’s a small club, and each ETF had an average of 22 APs registered to help, but only four active ones, on average.
Pretend a stock’s risen meteorically – think: Nvidia – and a fund needs to unload some to rebalance.
A mutual fund has to sell, realizing a distributable taxable gain.
An ETF can do that, and sometimes (though rarely, as we’ll see below) ETFs do.
But ETFs can also swap that high-appreciation share (along, usually with other shares) with an AP to essentially un–create ETF shares. (ETF shares are created when an AP buys a bunch of the actual securities the ETF intends to invest in, and then swaps them with the ETF issuer for ETF shares; redemption is this process in reverse.)
Passive ETFs follow strict rules and don’t have the discretionary ability to use this “in-kind” redemption process to tax manage to the extent that active ETFs do. Morningstar’s Stephen Welch asks if active ETFs are truly more tax-efficient. The answer is yes.
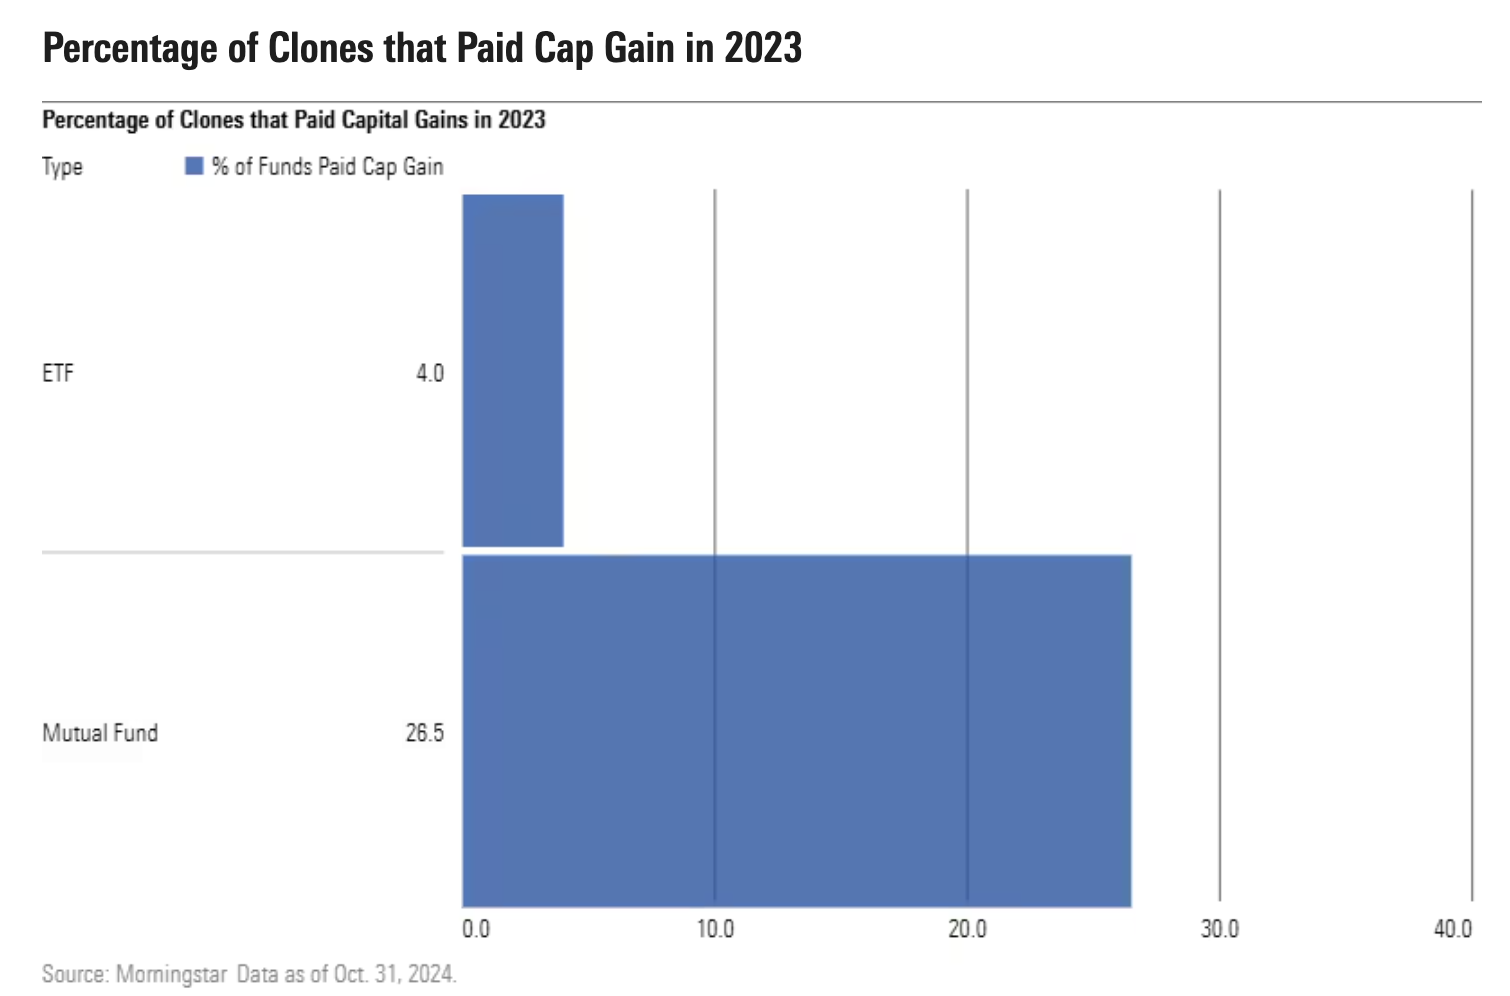
Stephen finds that from 2017, no more than 25% of active ETFs even had any taxable distributions in a given year, and those that distributed had distributions ranging from 1.2% to 3.8% of net asset value, or NAV. In 2023, for instance, just 4% of active ETFs paid a capital gain distribution, and collectively, distributions averaged 1.9% of NAV. Conversely, 34% of mutual funds paid out capital gains in 2023, with distributions averaging 3.6% of NAV.
So active ETFs appear to be more tax-efficient than active mutual funds.
Here’s a final chart showing, of instances where a fund company has both an ETF and a mutual fund essentially following the same strategy, how many fewer ETFs paid out capital gains. How long before ETFs kill mutual funds?
One step forward. Two steps back. Three steps forward.
One of the scary things about the stock market is that it moves around.
One of the nice things about the stock market is that it moves around.
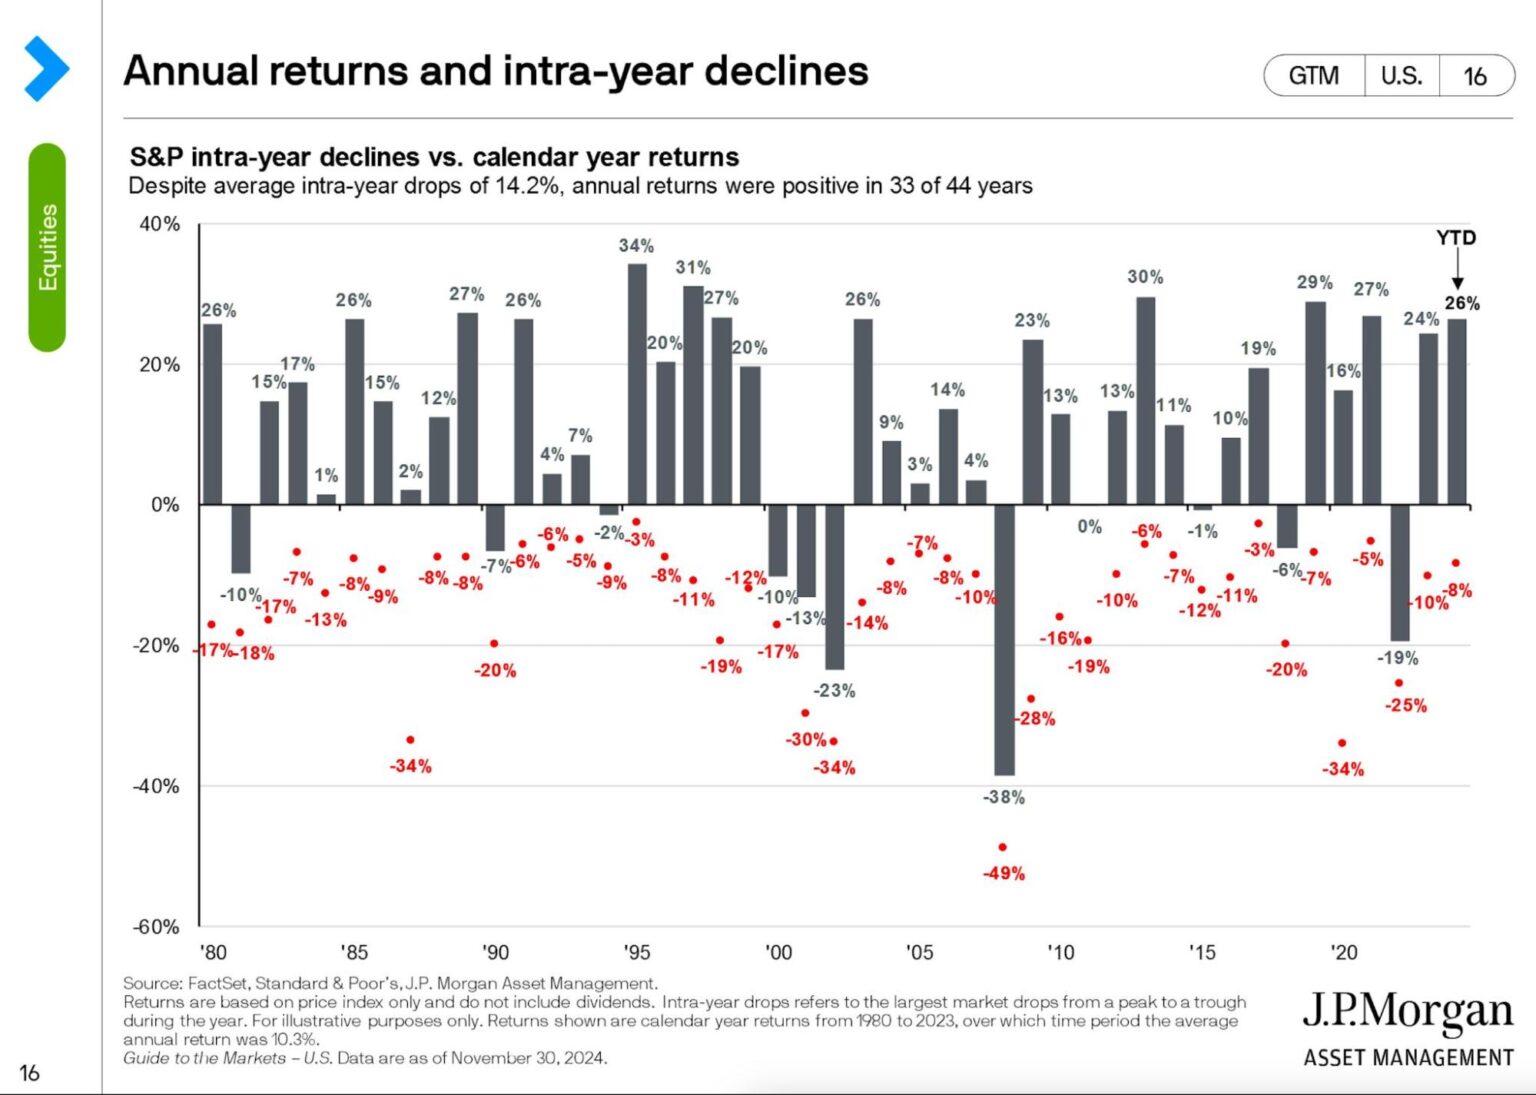
This is weird: Depending on your time period, the average yearly return for the S&P 500 is something like 9% or 10% – but the average intra-year drop is 14.2% (per JP Morgan Asset Management)! Eh?
Granted, that drop is from the past 44 years, but it’s something to wrap your head around: On average, the US stock market rises, but in the process of rising it temporarily drops more than it rises, going on to more than recover.
One step forward. Two steps back. Three steps forward. Something like that.
This article is for informational purposes only and is neither investment advice nor a solicitation to buy or sell securities. All investment involves inherent risks, including the total loss of principal, and past performance is not a guarantee of future results. Always conduct thorough research or consult with a financial expert before making any investment decisions. Neither James nor BBAE has a position in any investment mentioned.


